 6
6peptides
spectra
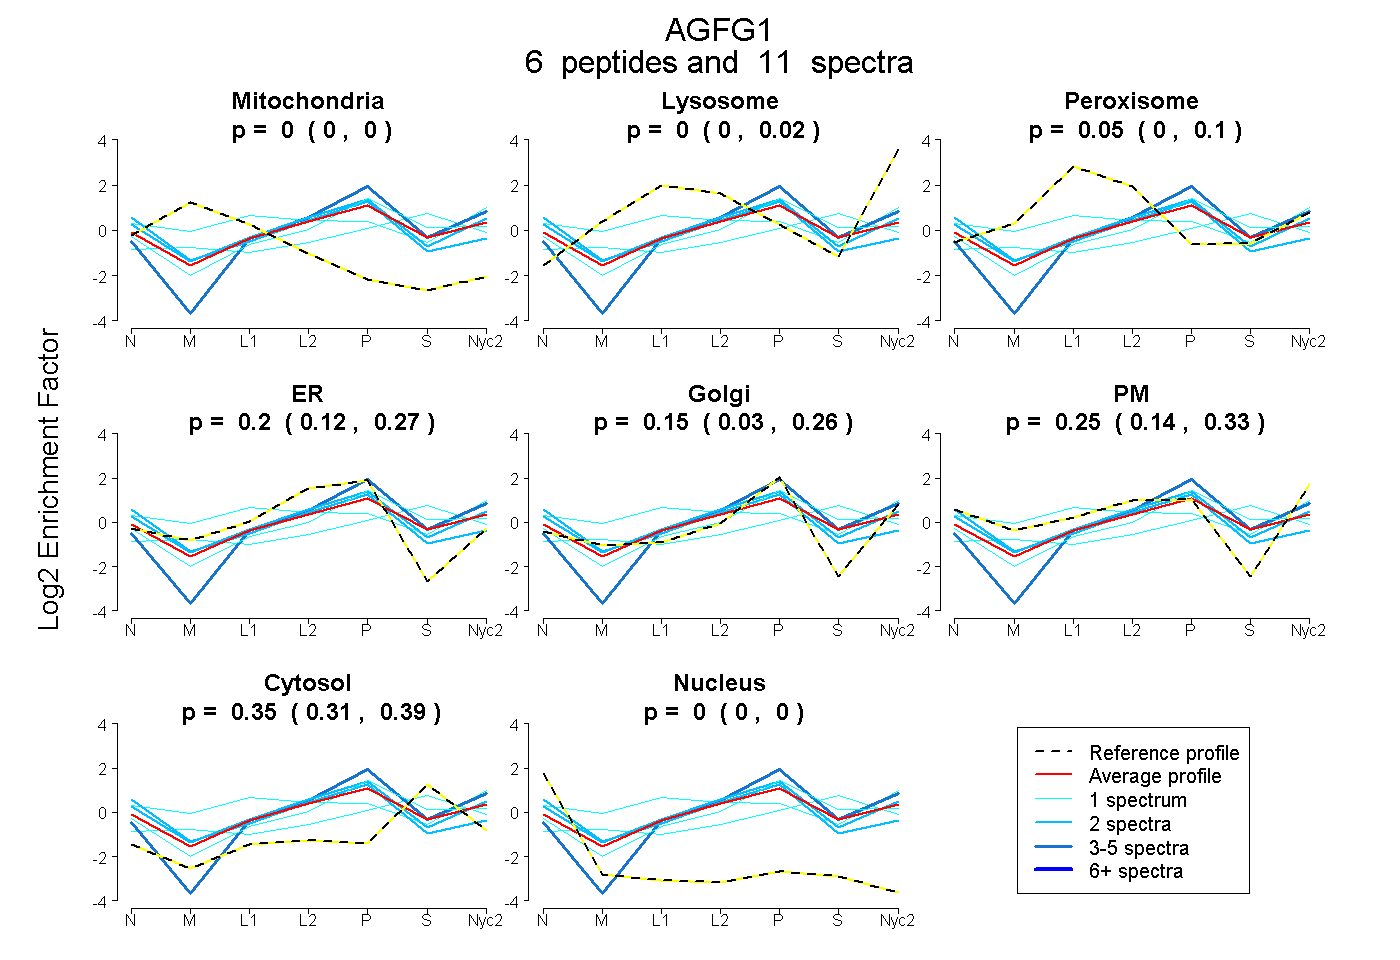
0.000 | 0.000
0.000 | 0.021
0.000 | 0.099
0.121 | 0.269
0.033 | 0.257
0.136 | 0.334
0.312 | 0.392
0.000 | 0.000
2peptides
spectra
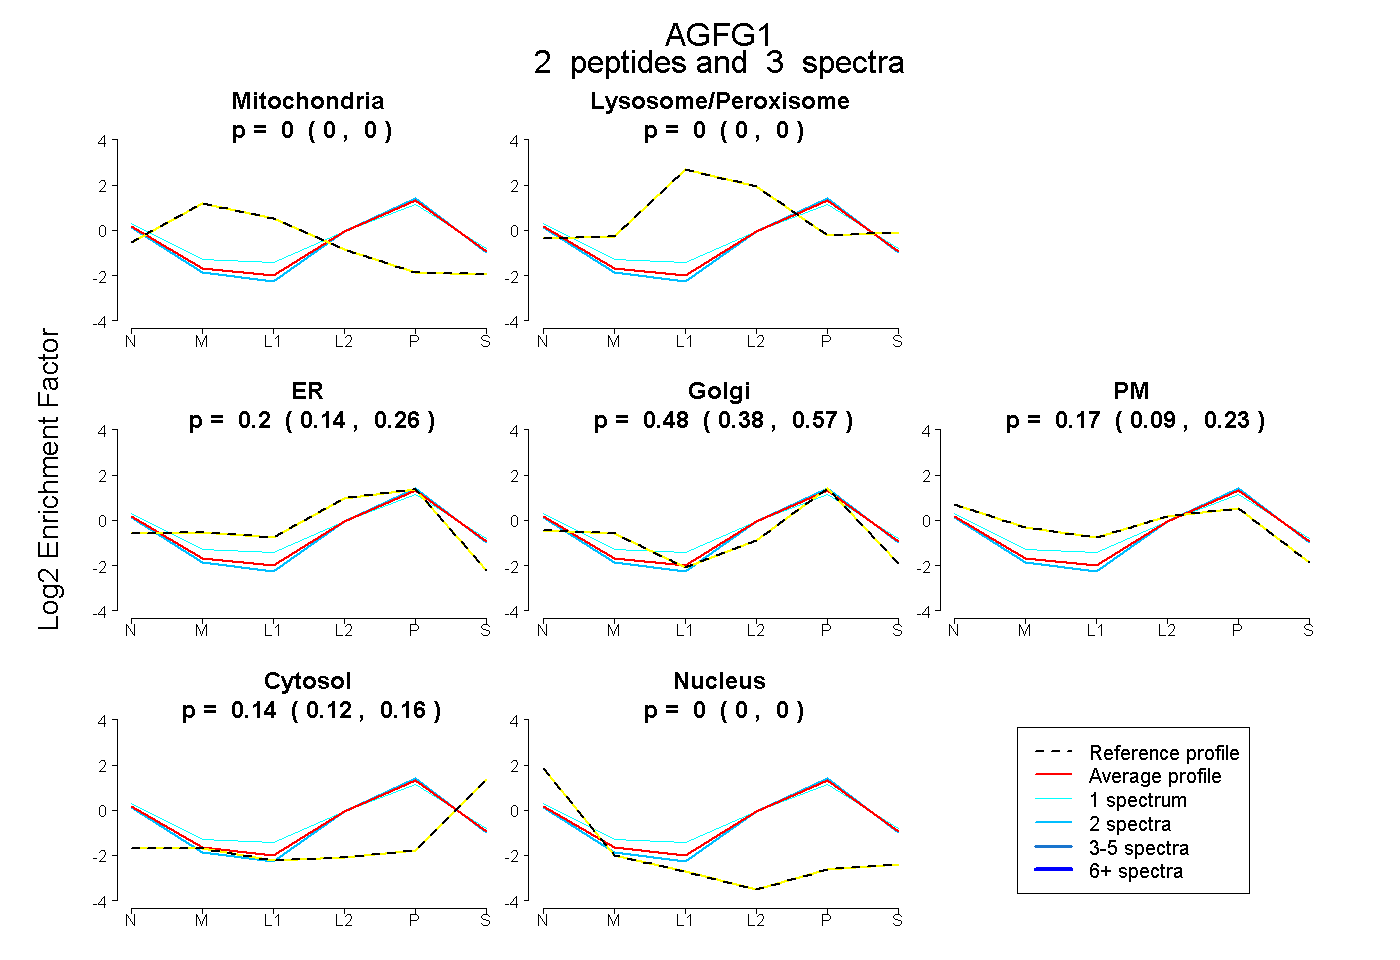
0.000 | 0.000
0.000 | 0.000
0.145 | 0.259
0.376 | 0.571
0.092 | 0.228
0.124 | 0.164
0.000 | 0.000
9peptides
spectra
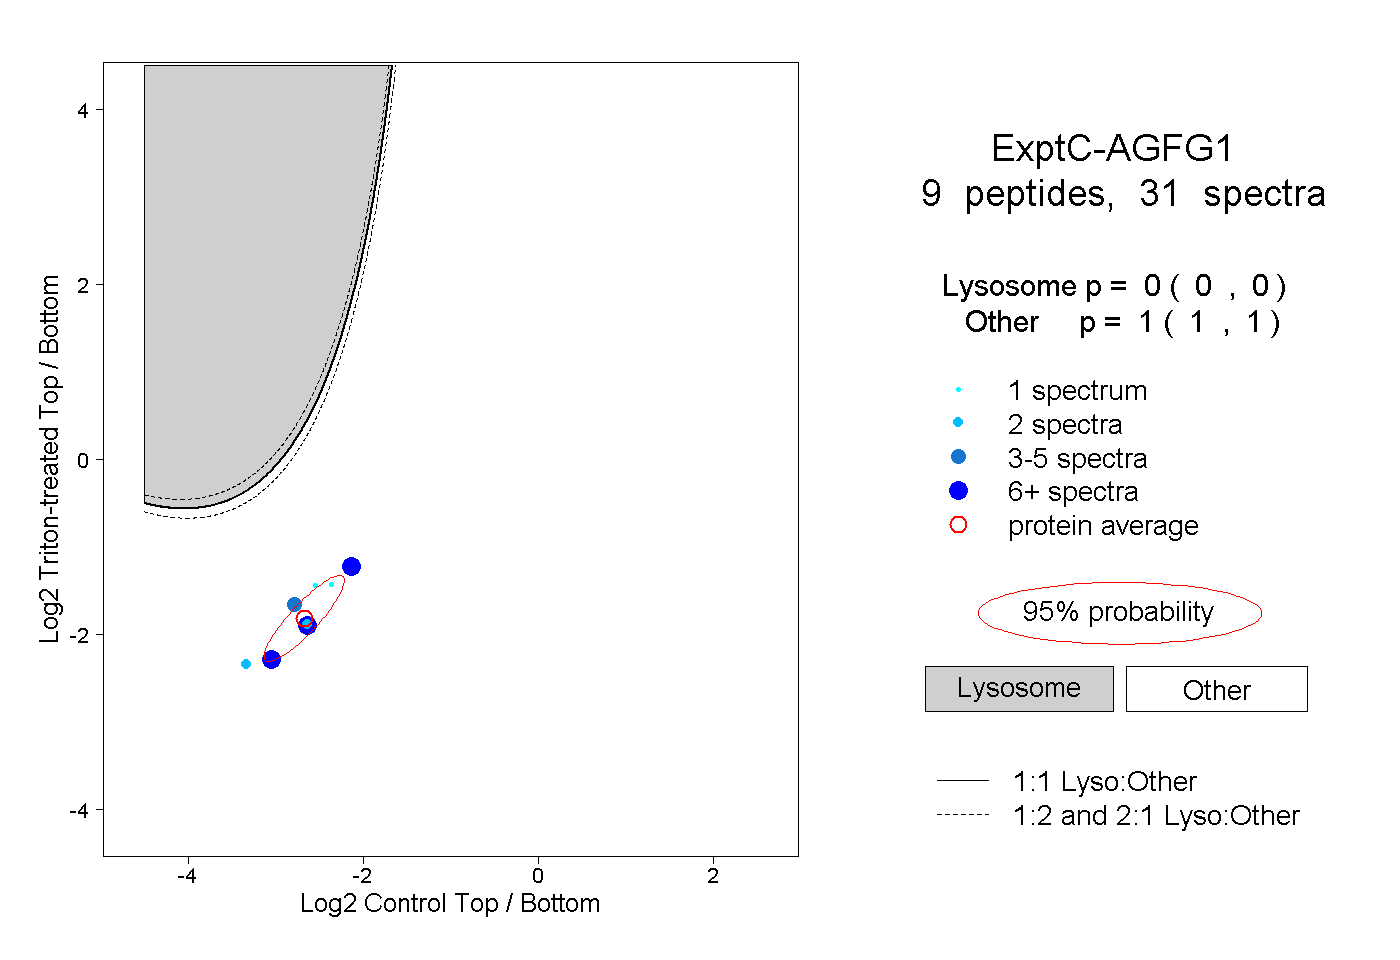
0.000 | 0.000
1.000 | 1.000
2peptides
spectra
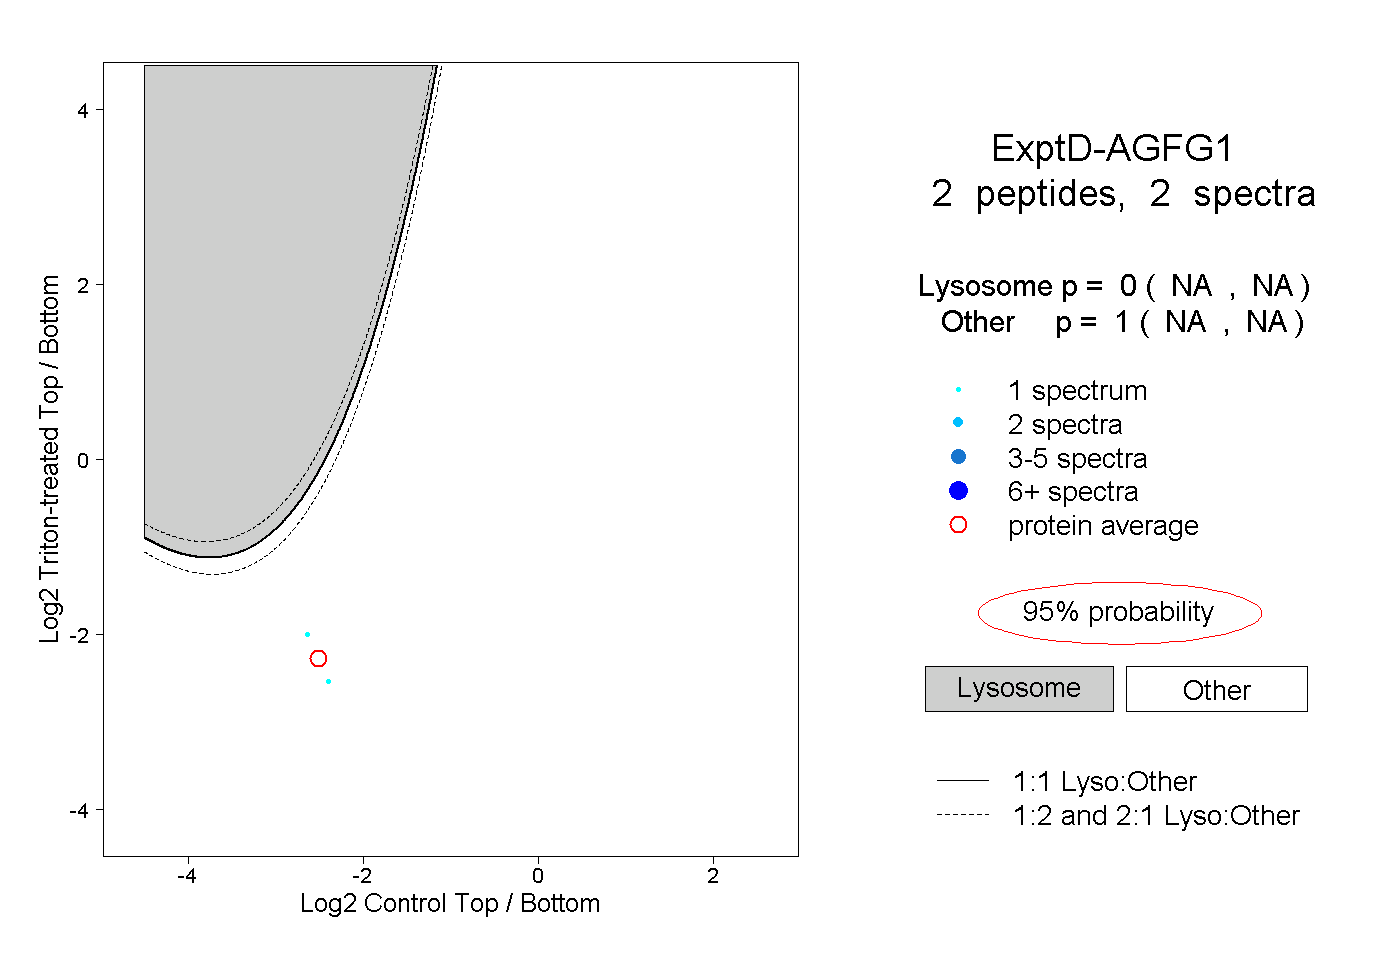
NA | NA
NA | NA