 2
2peptides
spectra
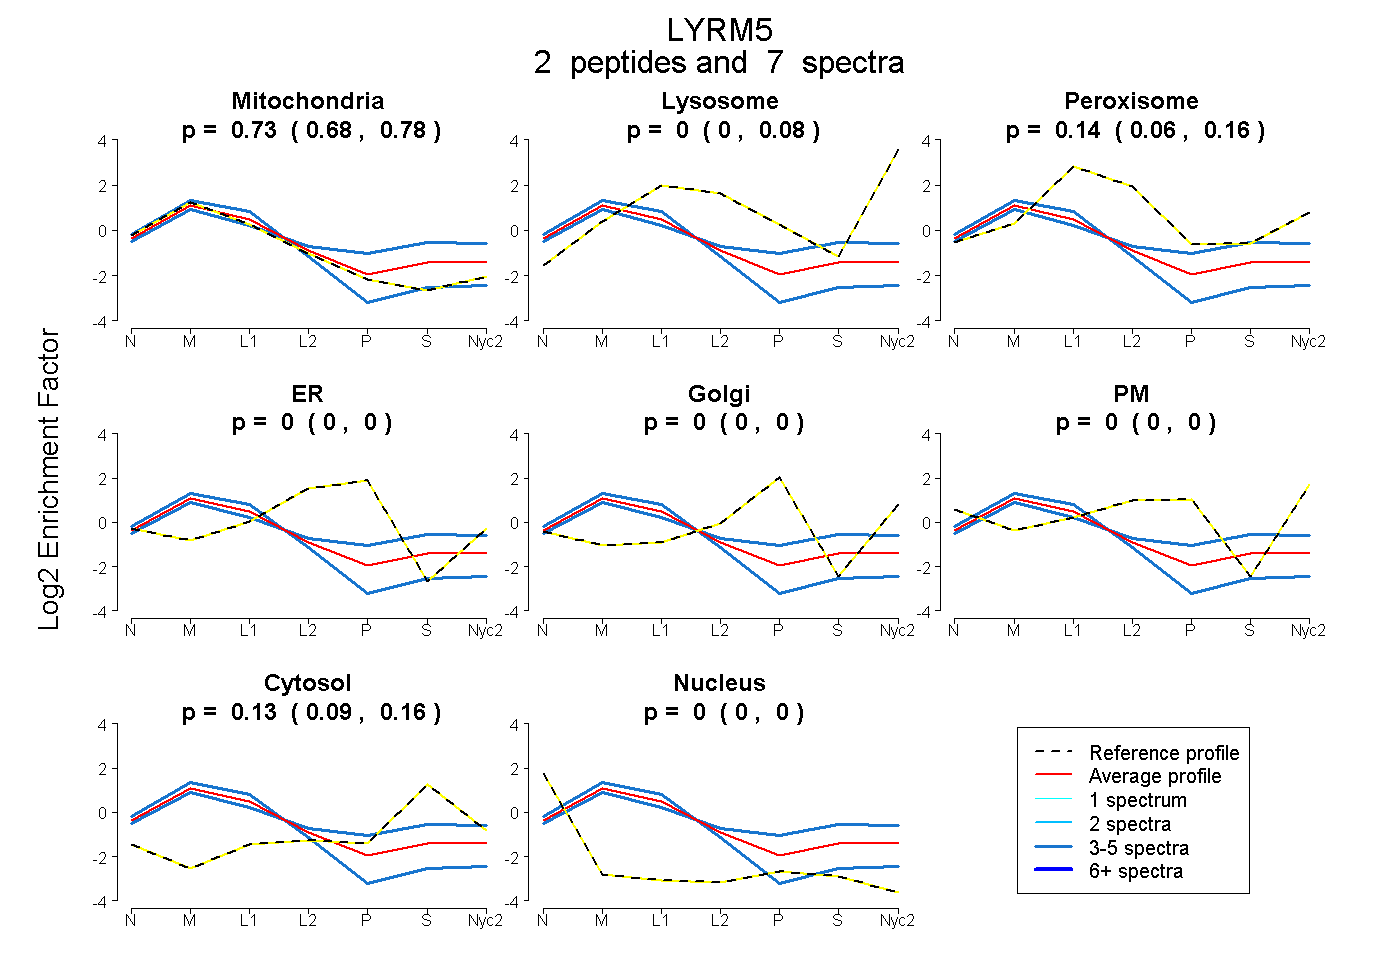
0.676 | 0.780
0.000 | 0.077
0.063 | 0.159
0.000 | 0.000
0.000 | 0.000
0.000 | 0.000
0.091 | 0.156
0.000 | 0.000
2peptides
spectra
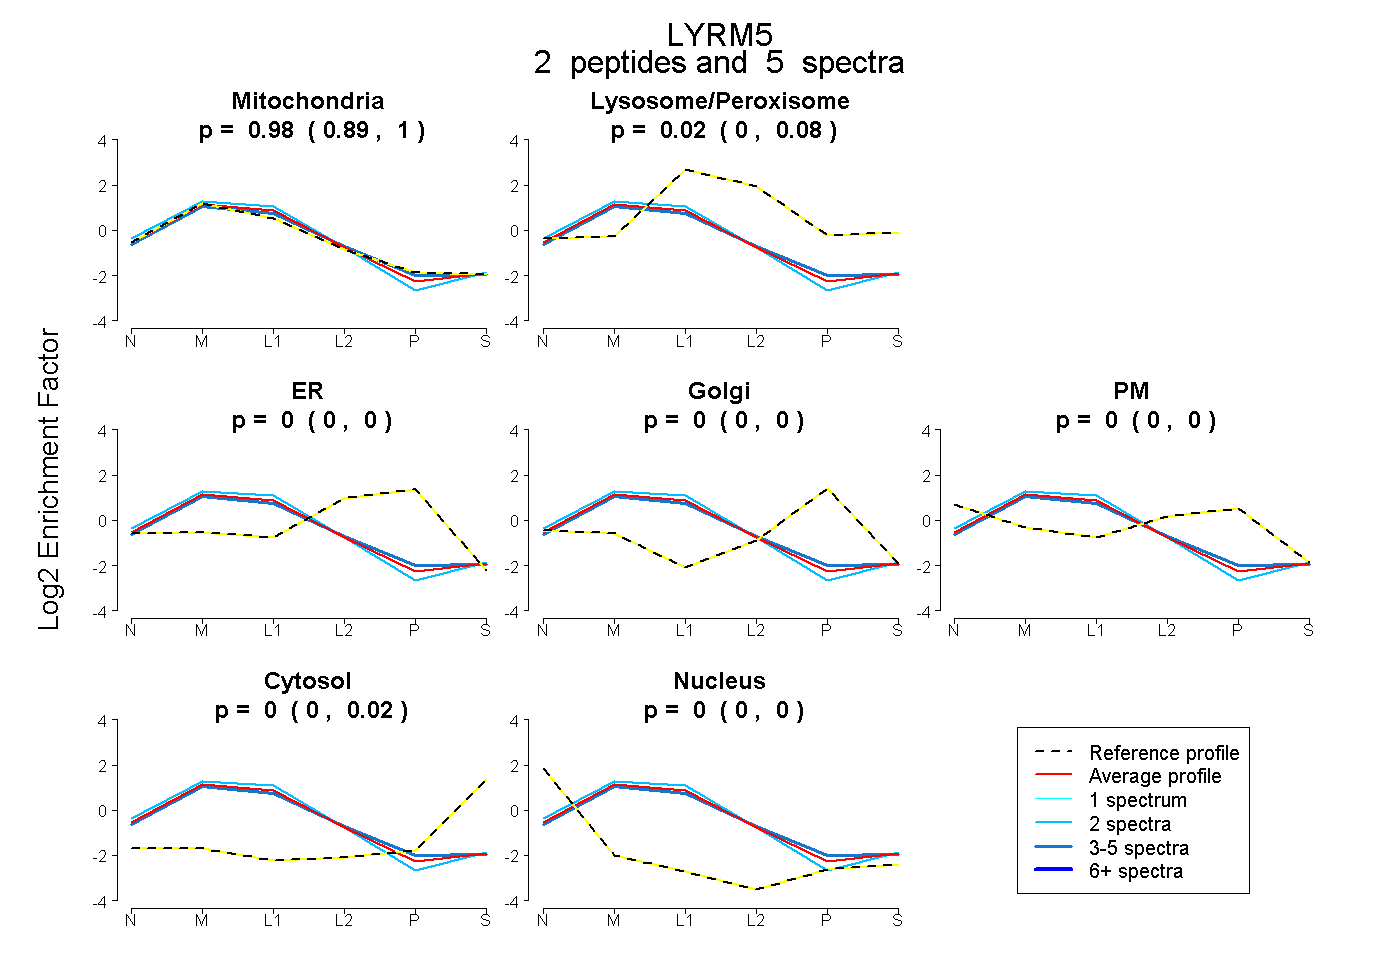
0.886 | 1.000
0.000 | 0.080
0.000 | 0.000
0.000 | 0.000
0.000 | 0.000
0.000 | 0.025
0.000 | 0.001
5peptides
spectra
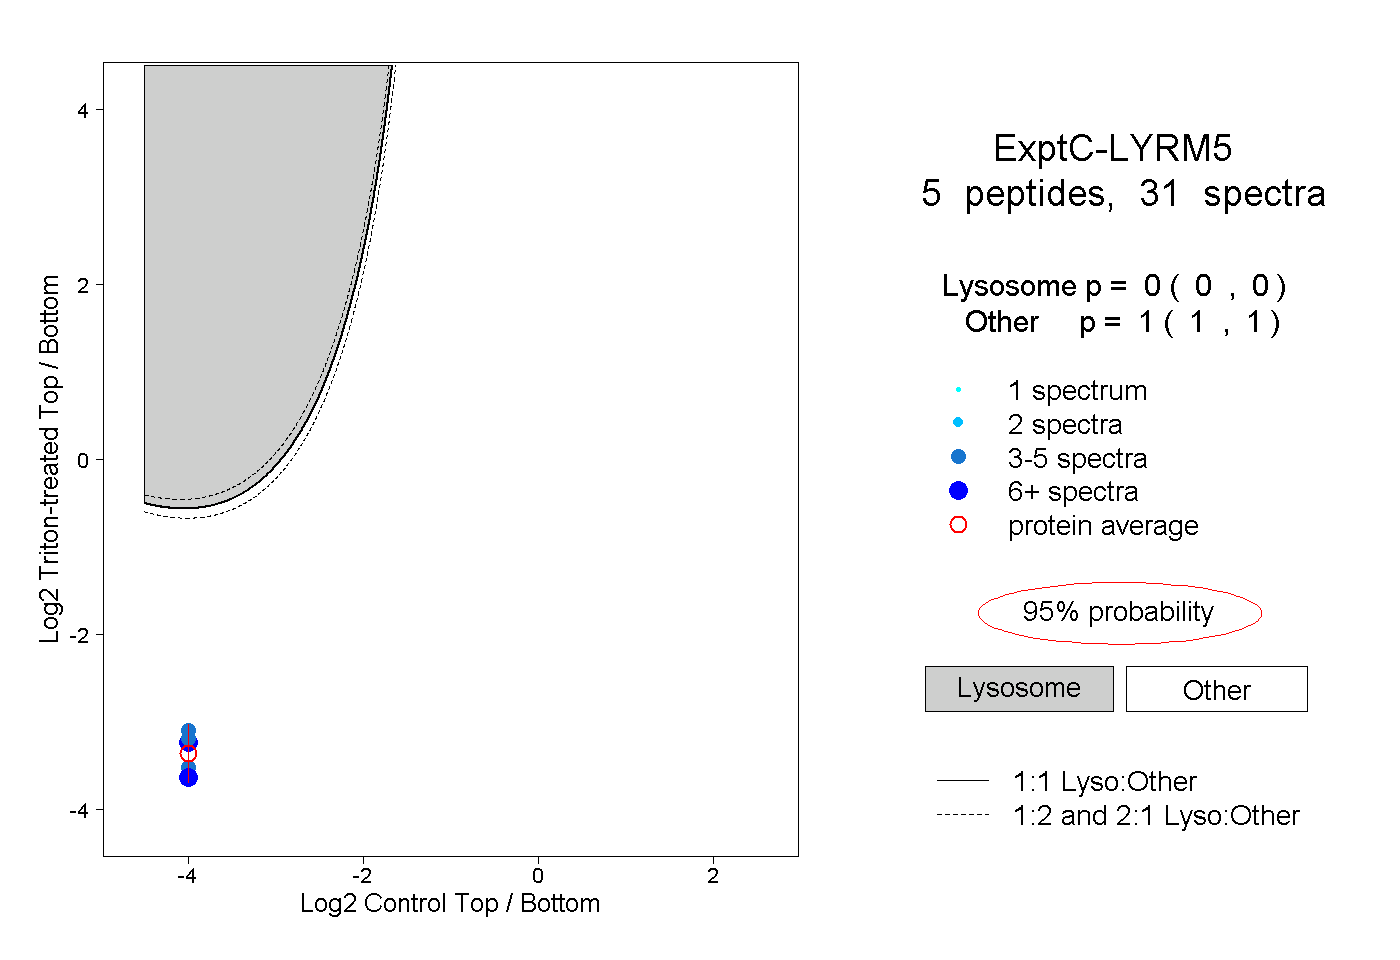
0.000 | 0.000
1.000 | 1.000
1peptide
spectrum
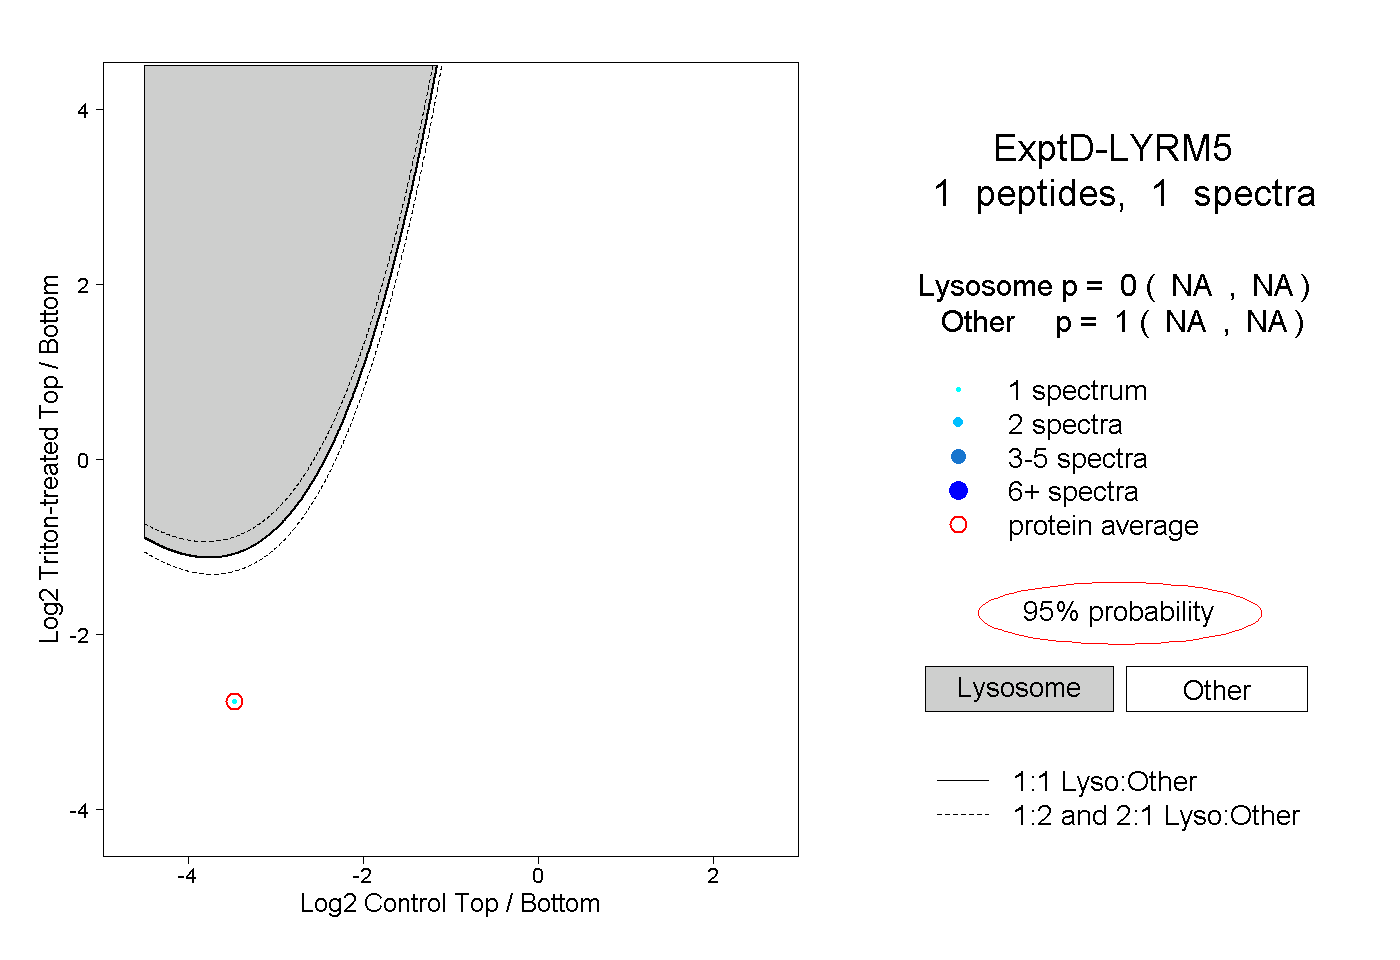
NA | NA
NA | NA