TRAPPC8
[ENSRNOP00000021263]
Main page
| | | Plot |
Mito |
Lyso |
|
Perox |
ER |
Golgi |
PM |
Cytosol |
Nucleus |
|
| Expt A |
 18
18
peptides |
35
spectra |
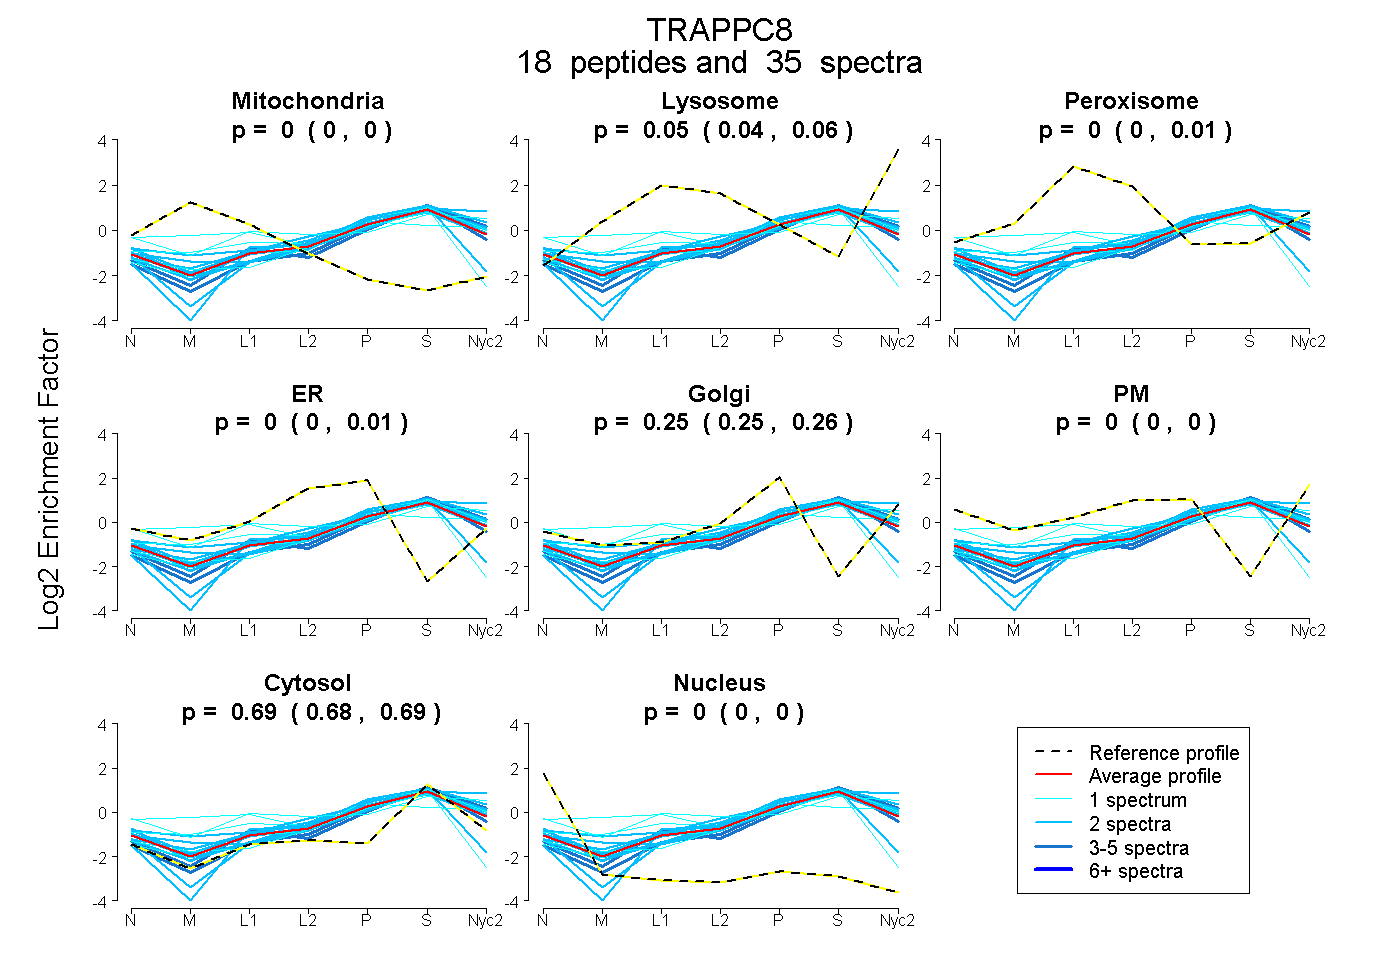 |
0.000
0.000 | 0.000 |
0.054
0.039 | 0.061 |
|
0.001
0.000 | 0.012 |
0.000
0.000 | 0.007 |
0.255
0.246 | 0.259 |
0.000
0.000 | 0.000 |
0.690
0.684 | 0.694 |
0.000
0.000 | 0.000 |
|
| | | Plot |
Mito |
|
Lyso or Perox |
|
ER |
Golgi |
PM |
Cytosol |
Nucleus |
|
| Expt B |
4
peptides |
4
spectra |
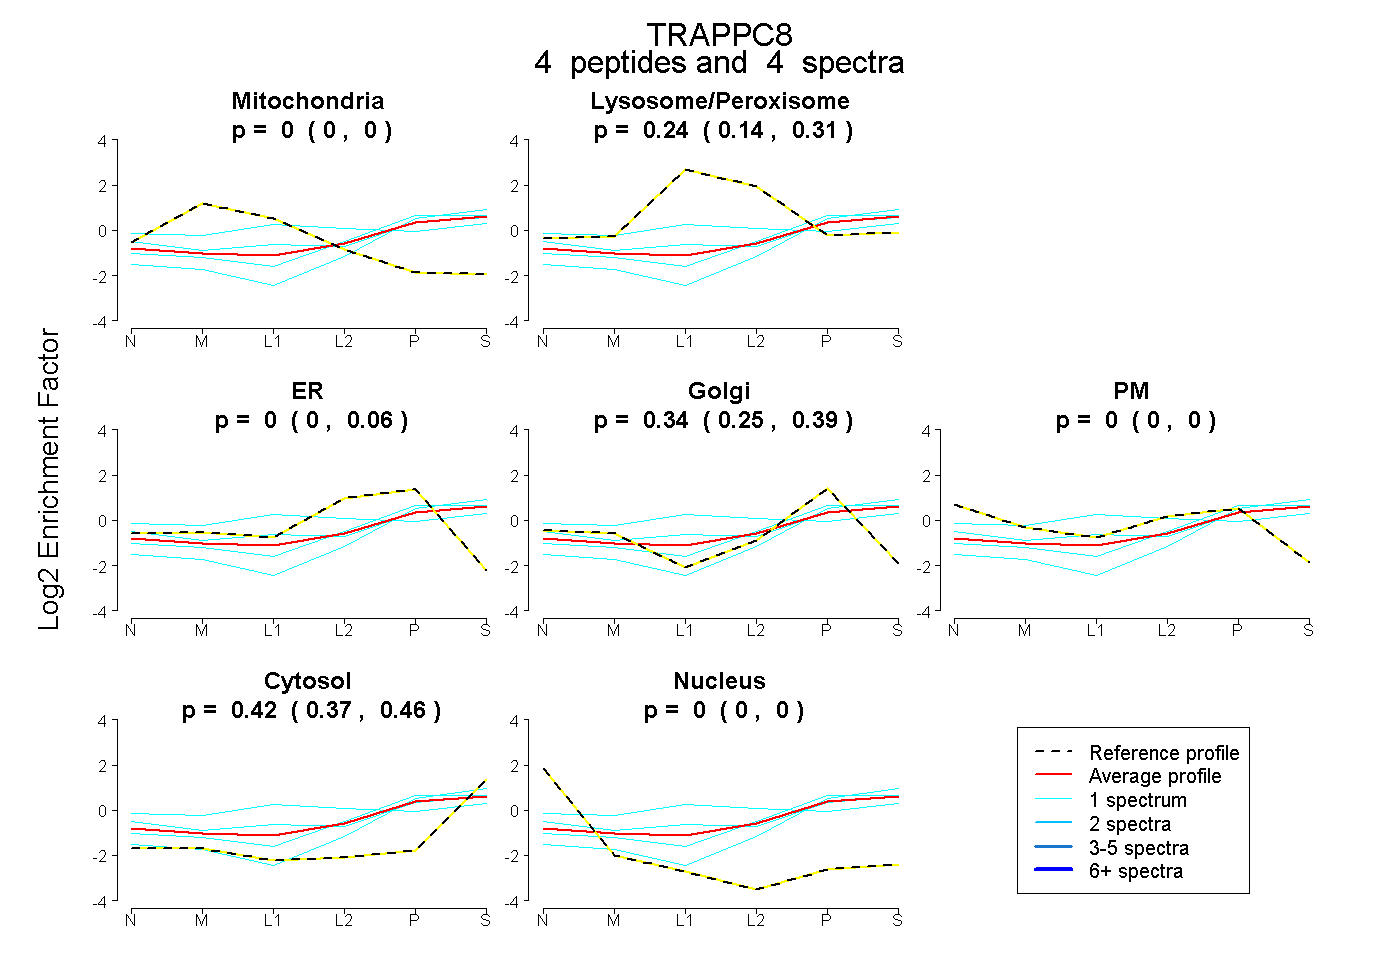 |
0.000
0.000 | 0.000 |
|
0.243
0.140 | 0.311 |
|
0.000
0.000 | 0.063 |
0.342
0.248 | 0.393 |
0.000
0.000 | 0.000 |
0.415
0.371 | 0.459 |
0.000
0.000 | 0.000 |
|
| | | Plot |
|
Lyso |
|
|
|
|
|
|
|
Other |
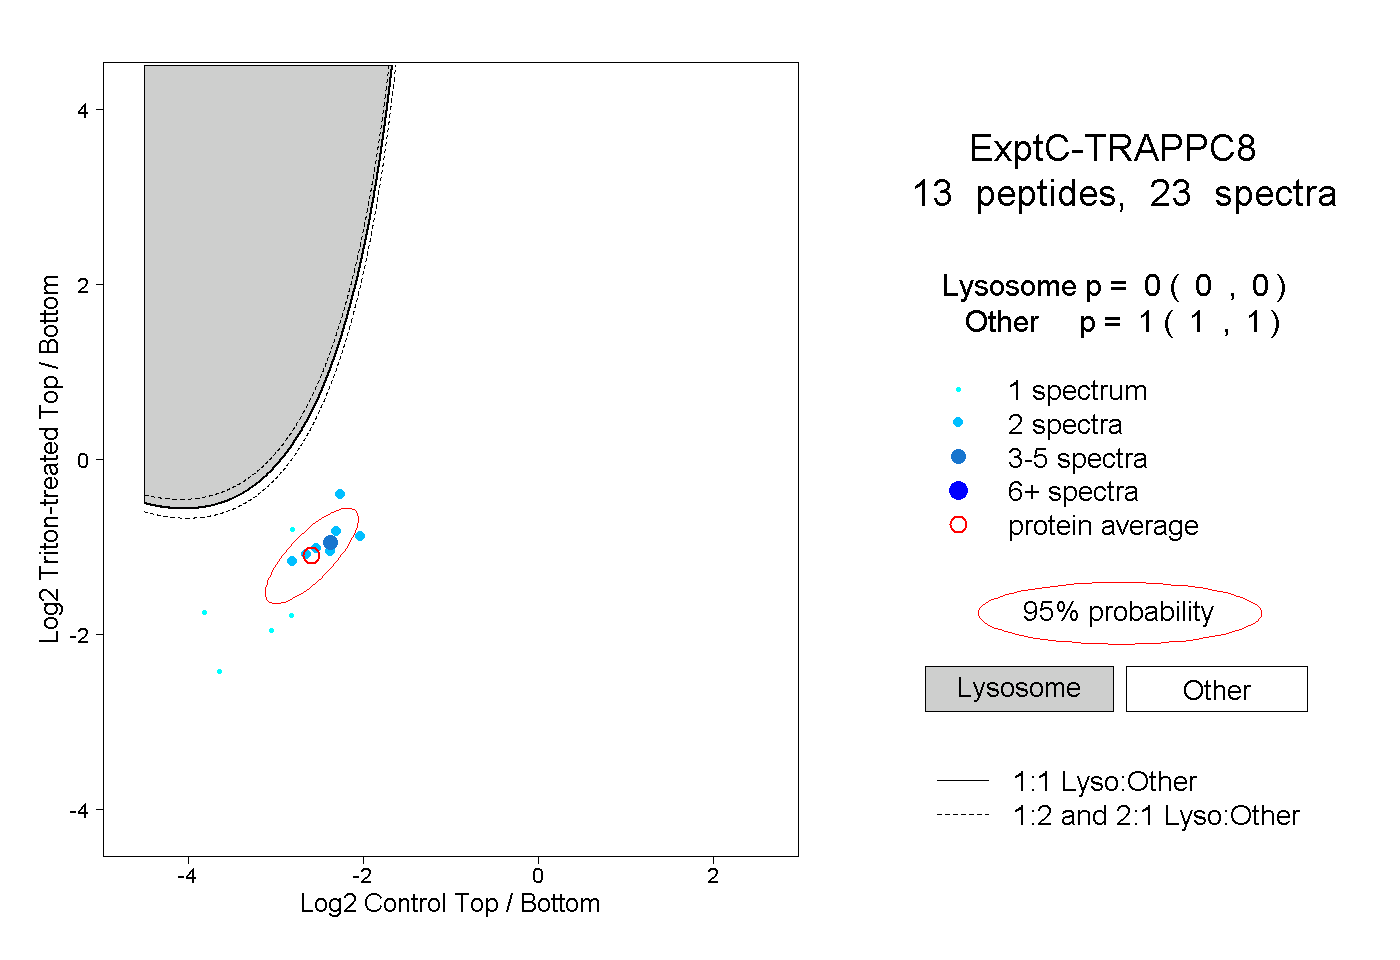
| Expt C |
13
peptides |
23
spectra |
 |
|
0.000
0.000 | 0.000 |
|
|
|
|
|
|
|
1.000
1.000 | 1.000 |
| 2 spectra, WFIPNTLK |
|
0.000 |
|
|
|
|
|
|
|
1.000 |
| 1 spectrum, SVNISENR |
|
0.000 |
|
|
|
|
|
|
|
1.000 |
| 2 spectra, RPADGEK |
|
0.000 |
|
|
|
|
|
|
|
1.000 |
| 1 spectrum, SLSSELR |
|
0.000 |
|
|
|
|
|
|
|
1.000 |
| 2 spectra, GLLPHVEK |
|
0.000 |
|
|
|
|
|
|
|
1.000 |
| 2 spectra, YAEAAALLIR |
|
0.000 |
|
|
|
|
|
|
|
1.000 |
| 1 spectrum, VFFGHDR |
|
0.000 |
|
|
|
|
|
|
|
1.000 |
| 2 spectra, DGLPDNCR |
|
0.000 |
|
|
|
|
|
|
|
1.000 |
| 2 spectra, EYLYVYK |
|
0.000 |
|
|
|
|
|
|
|
1.000 |
| 4 spectra, LTSEDSDLR |
|
0.000 |
|
|
|
|
|
|
|
1.000 |
| 1 spectrum, IQHNSDYSYPK |
|
0.000 |
|
|
|
|
|
|
|
1.000 |
| 1 spectrum, NMVLAER |
|
0.000 |
|
|
|
|
|
|
|
1.000 |
| 2 spectra, EACSHSQK |
|
0.000 |
|
|
|
|
|
|
|
1.000 |
| | | Plot |
|
Lyso |
|
|
|
|
|
|
|
Other |
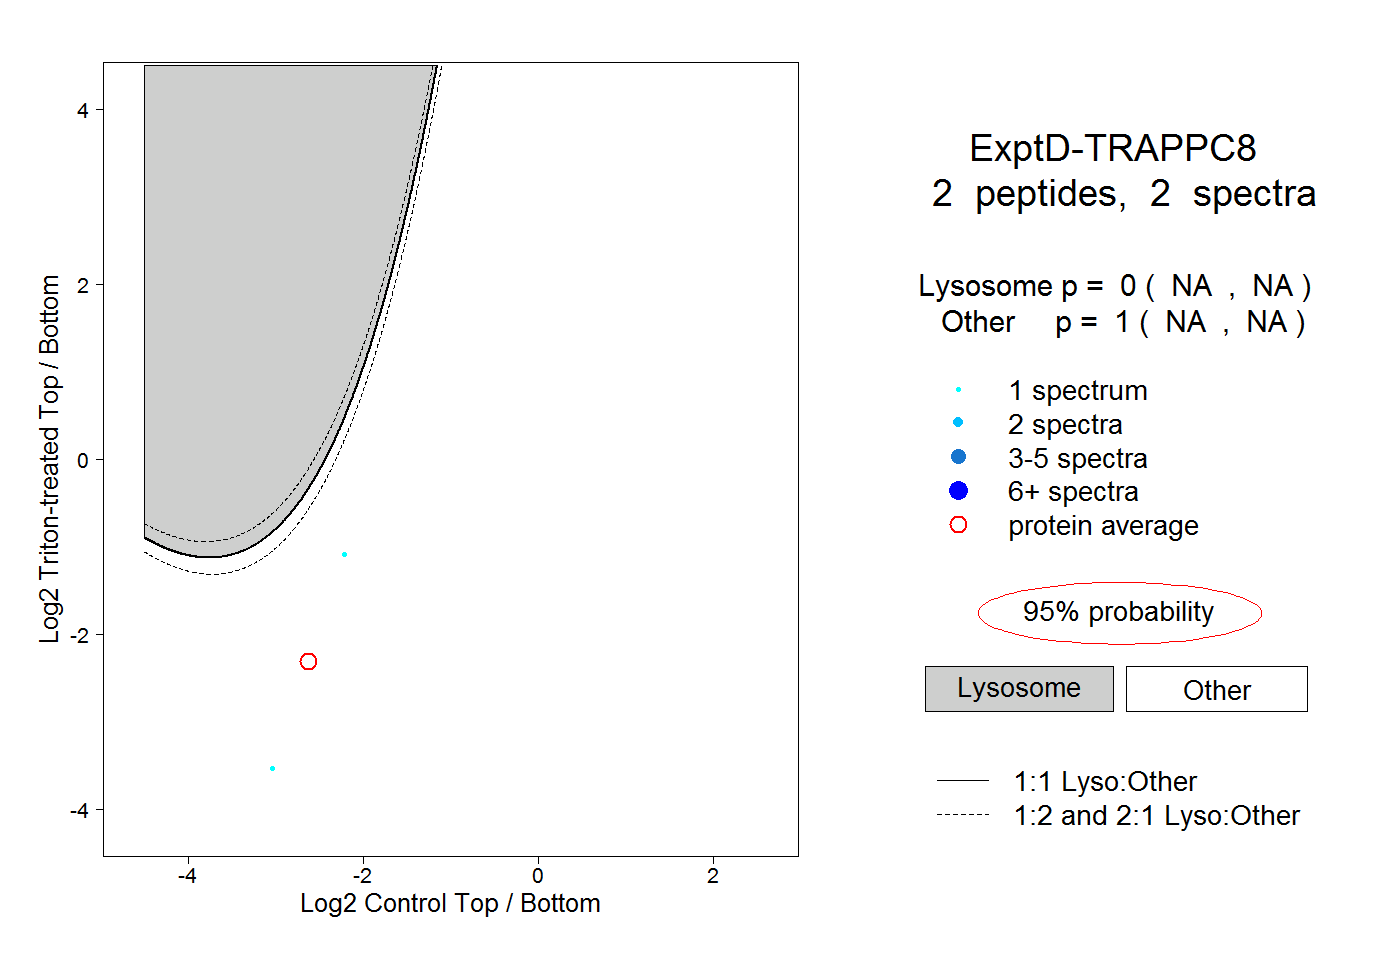
| Expt D |
2
peptides |
2
spectra |
 |
|
0.000
NA | NA |
|
|
|
|
|
|
|
1.000
NA | NA |