18
18peptides
spectra
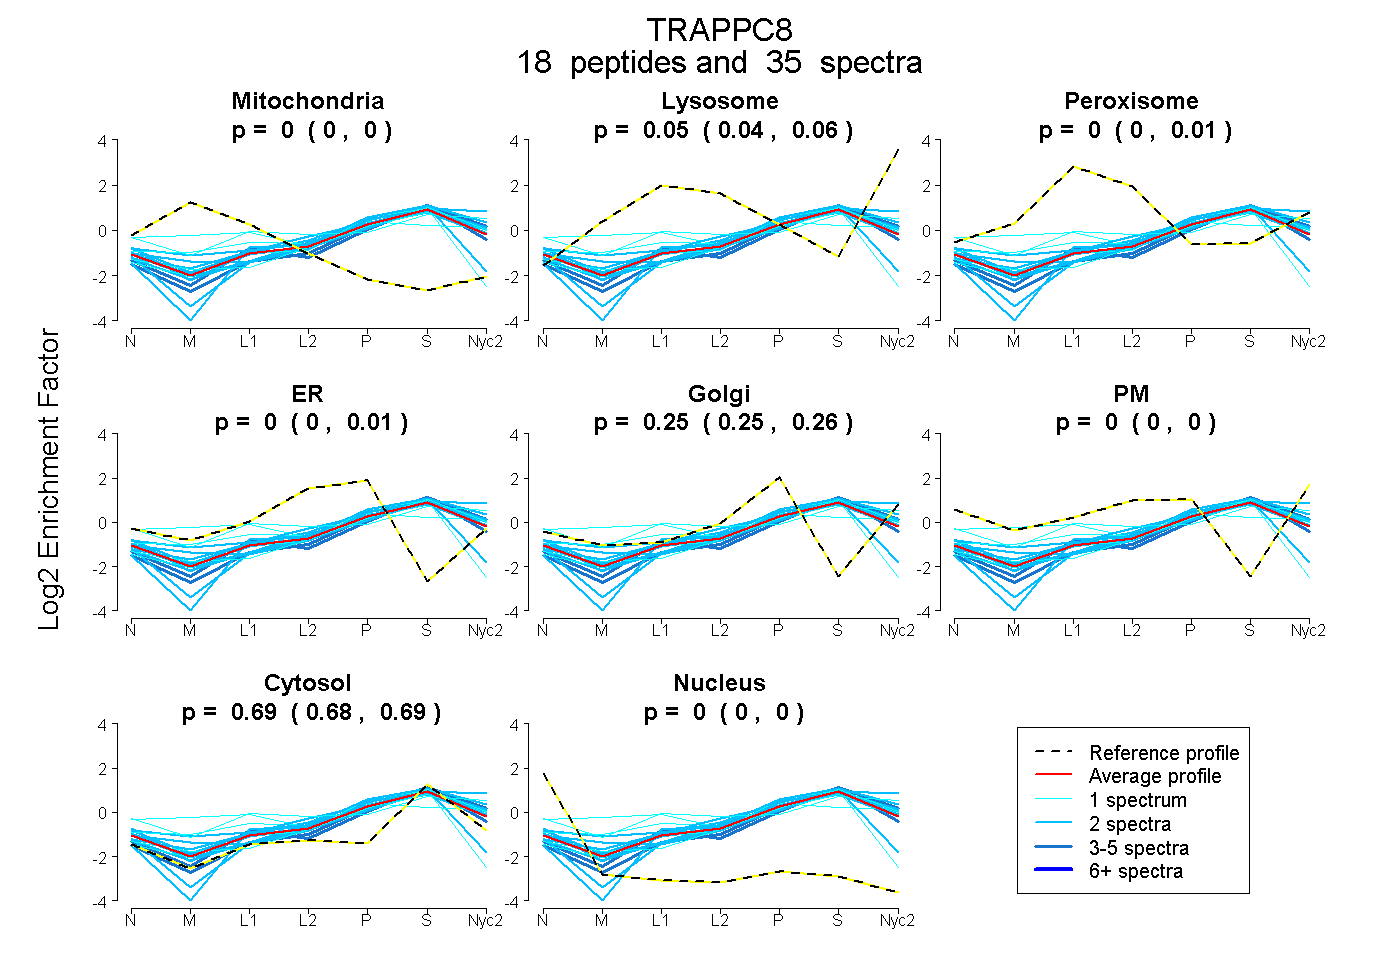
0.000 | 0.000
0.039 | 0.061
0.000 | 0.012
0.000 | 0.007
0.246 | 0.259
0.000 | 0.000
0.684 | 0.694
0.000 | 0.000
4peptides
spectra
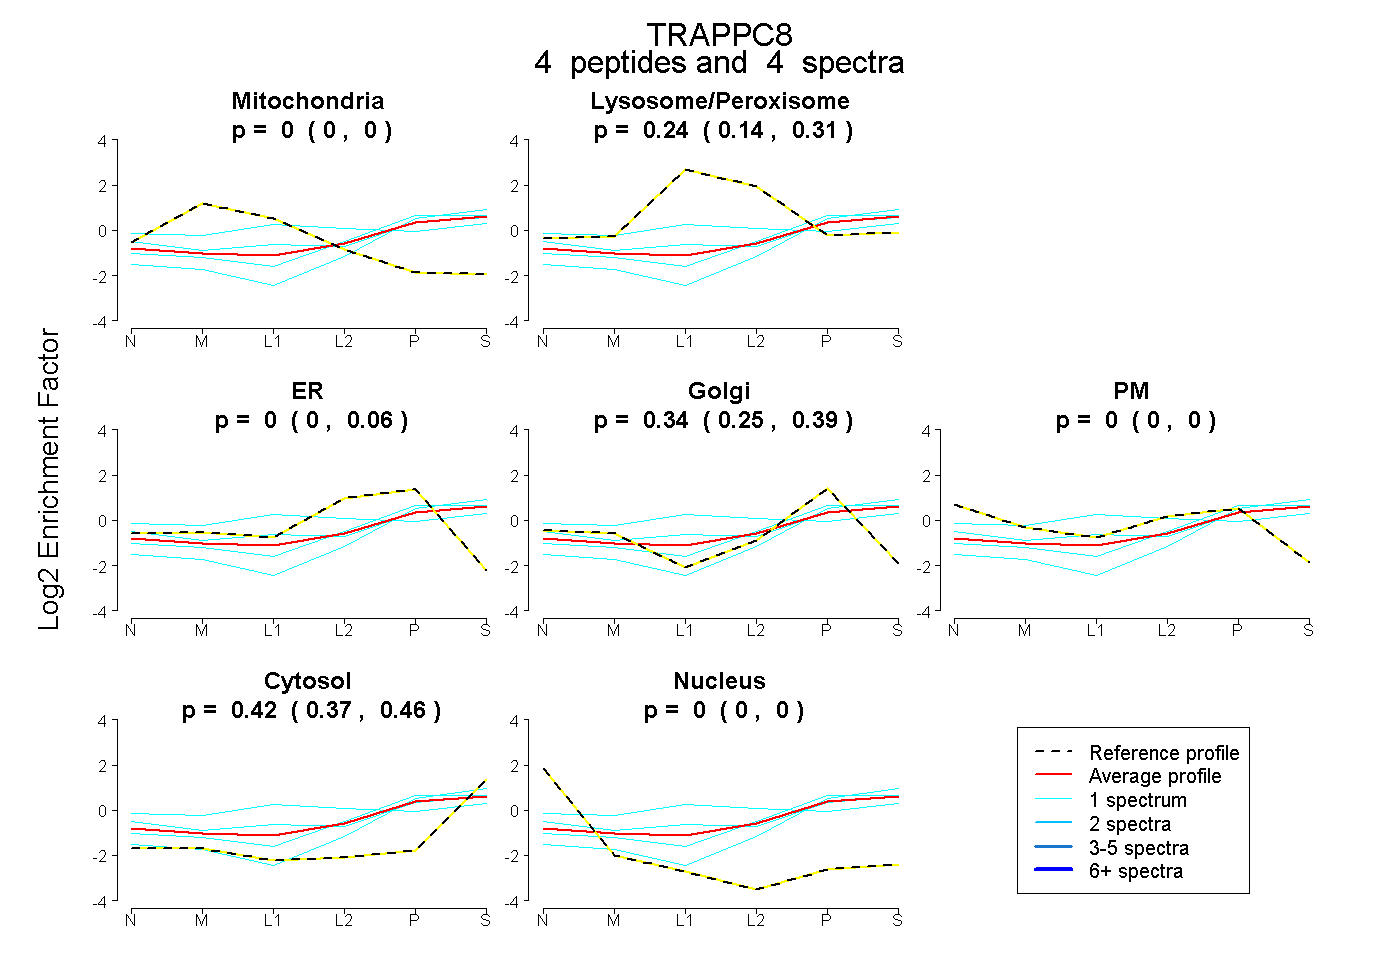
0.000 | 0.000
0.140 | 0.311
0.000 | 0.063
0.248 | 0.393
0.000 | 0.000
0.371 | 0.459
0.000 | 0.000