 3
3peptides
spectra
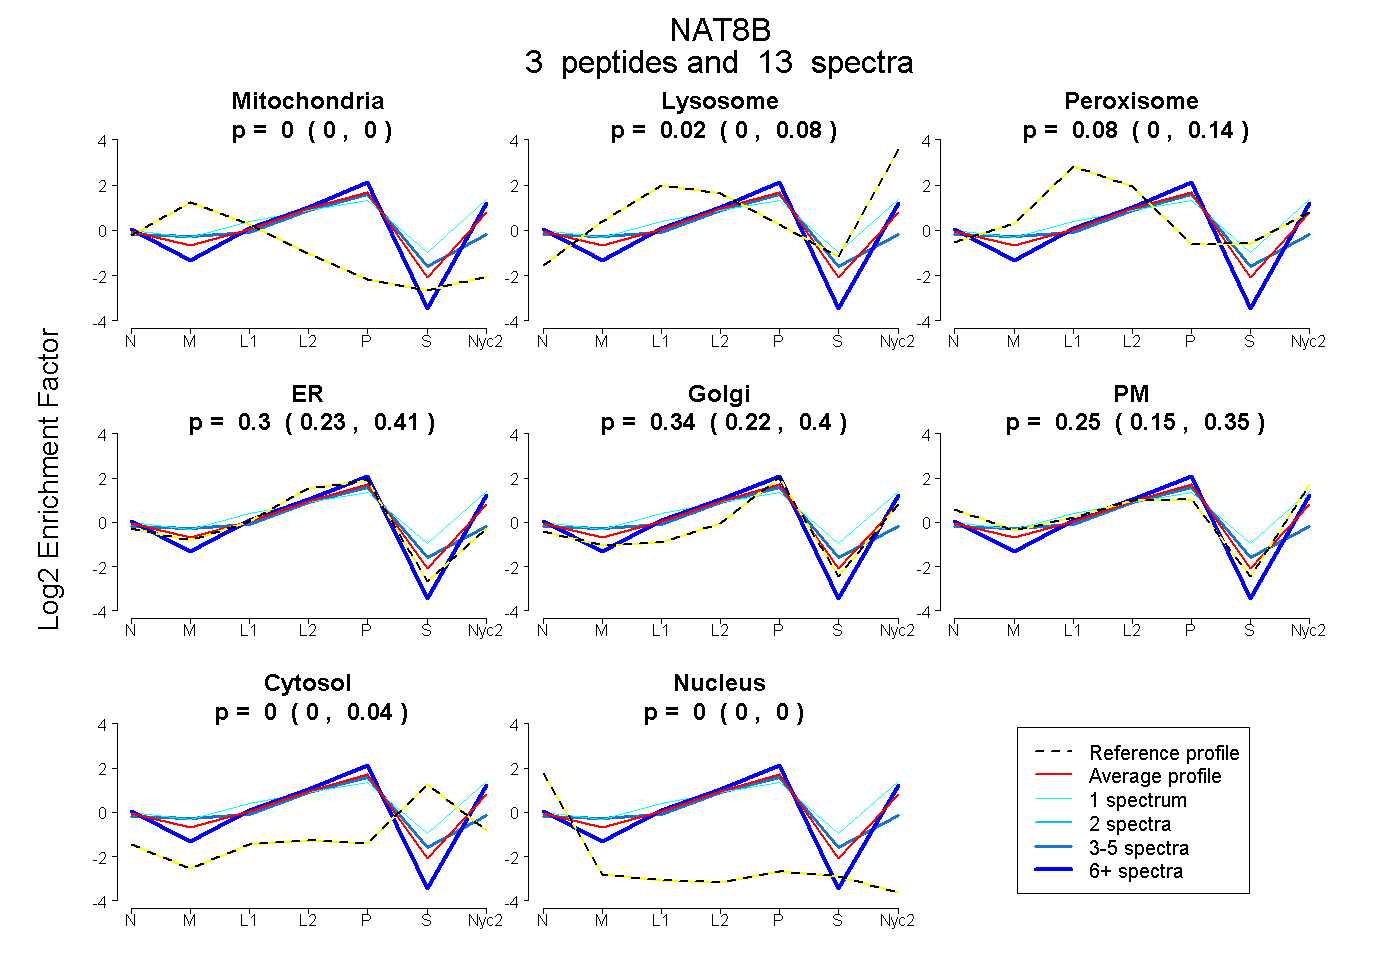
0.000 | 0.000
0.000 | 0.077
0.000 | 0.140
0.228 | 0.409
0.224 | 0.401
0.149 | 0.347
0.000 | 0.035
0.000 | 0.000
1peptide
spectra
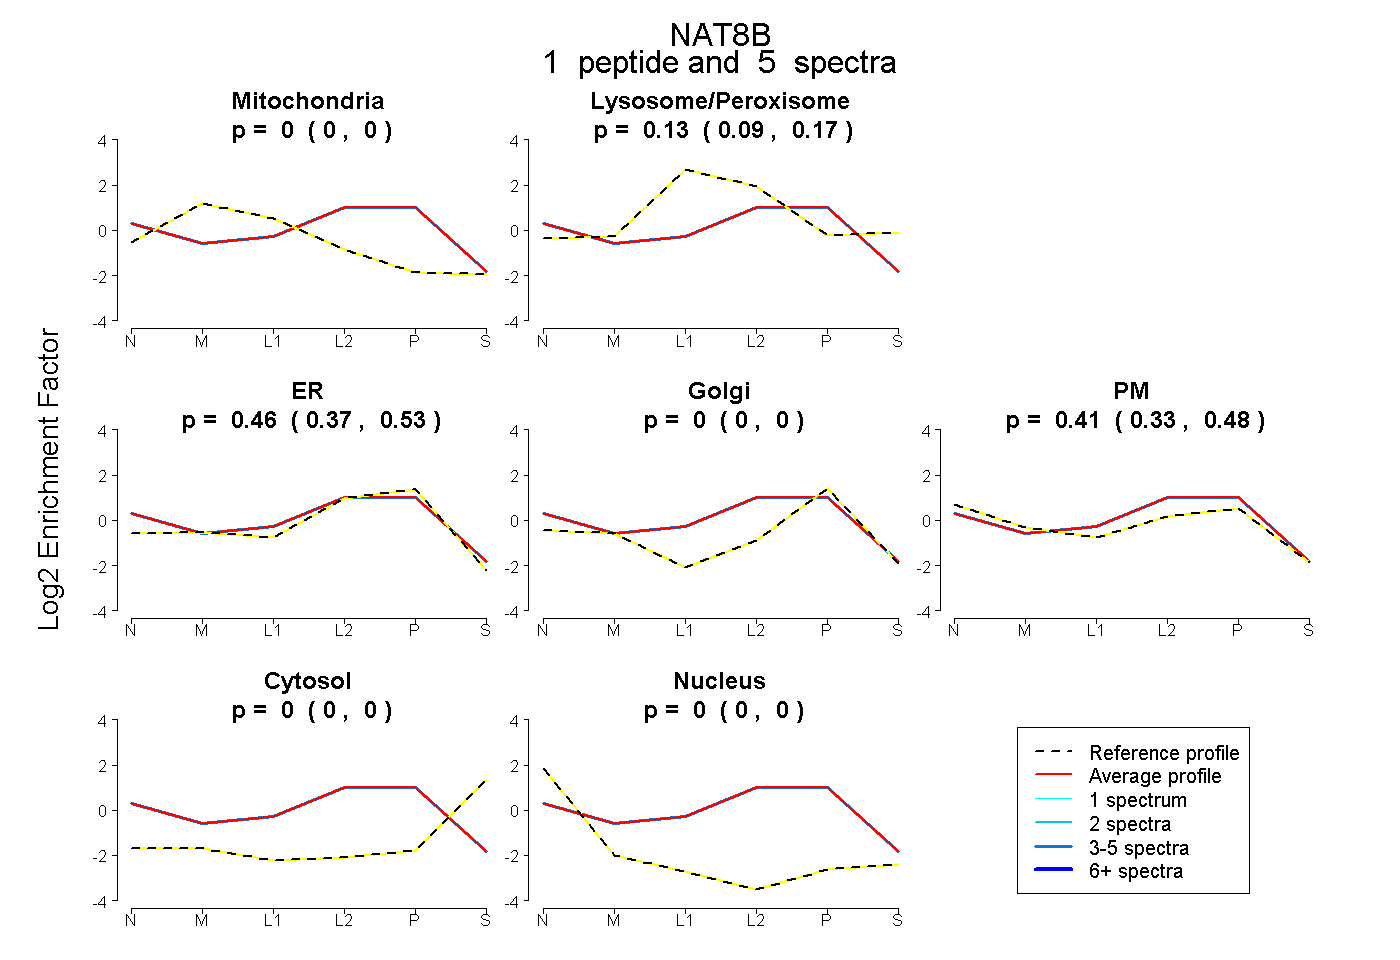
0.000 | 0.000
0.090 | 0.166
0.370 | 0.530
0.000 | 0.000
0.330 | 0.476
0.000 | 0.000
0.000 | 0.000
1peptide
spectra
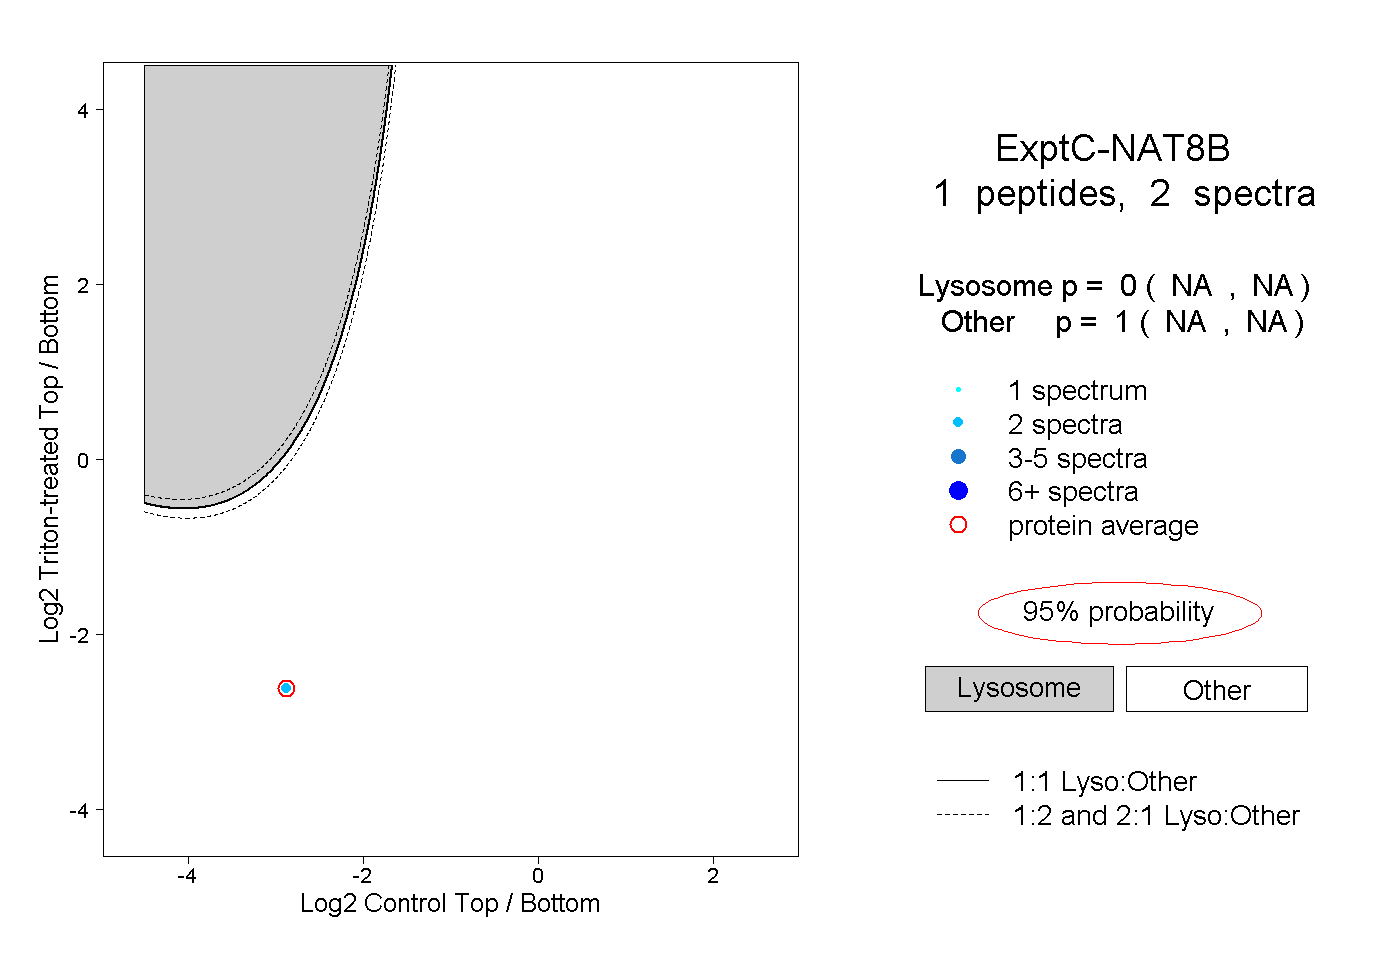
NA | NA
NA | NA
1peptide
spectra
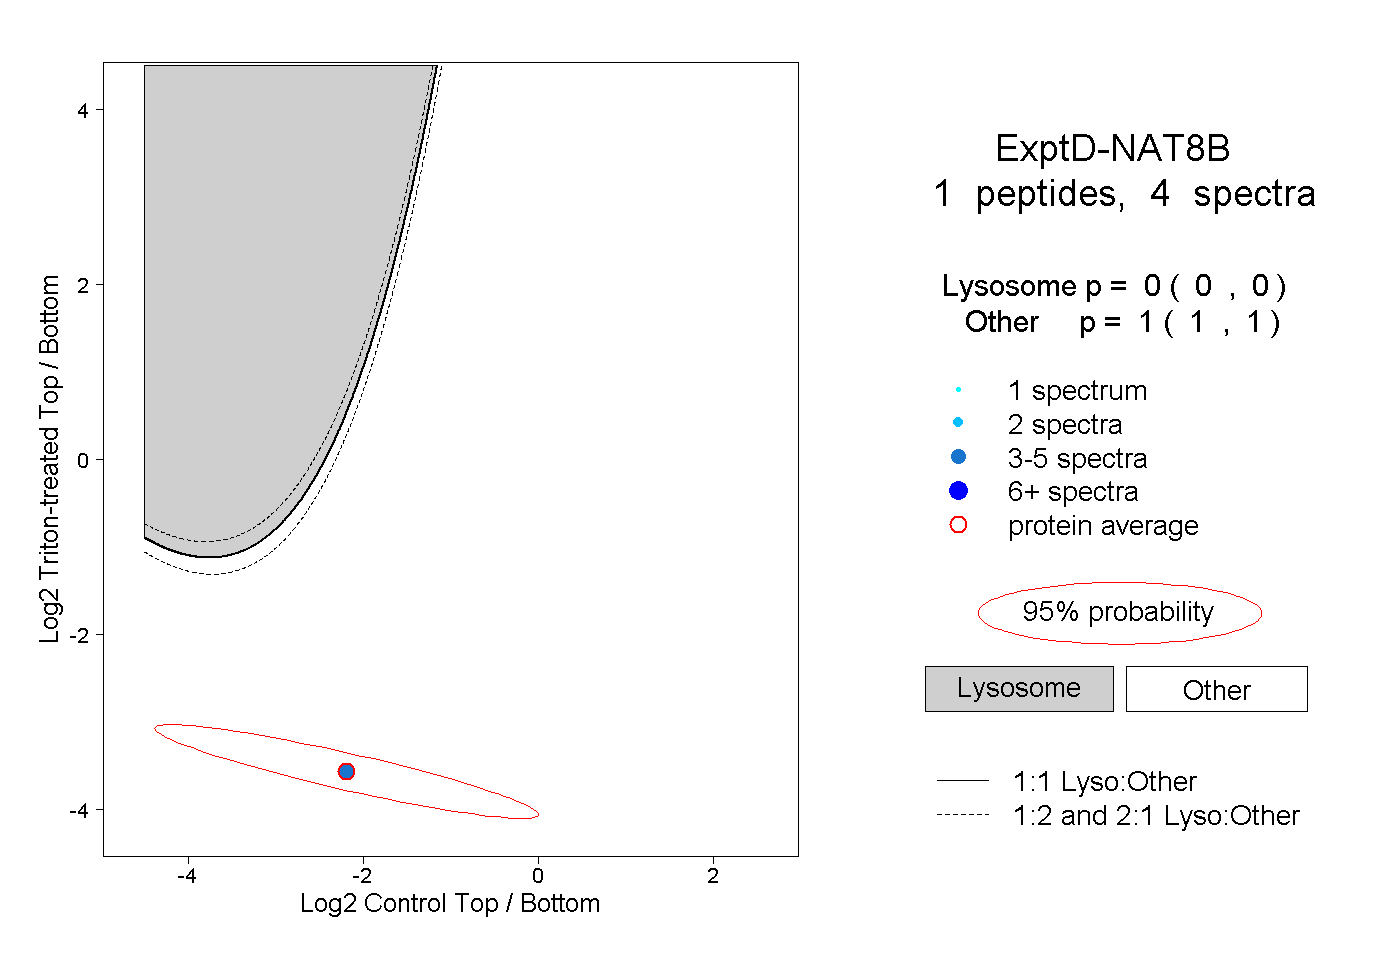
0.000 | 0.000
1.000 | 1.000