 17
17peptides
spectra
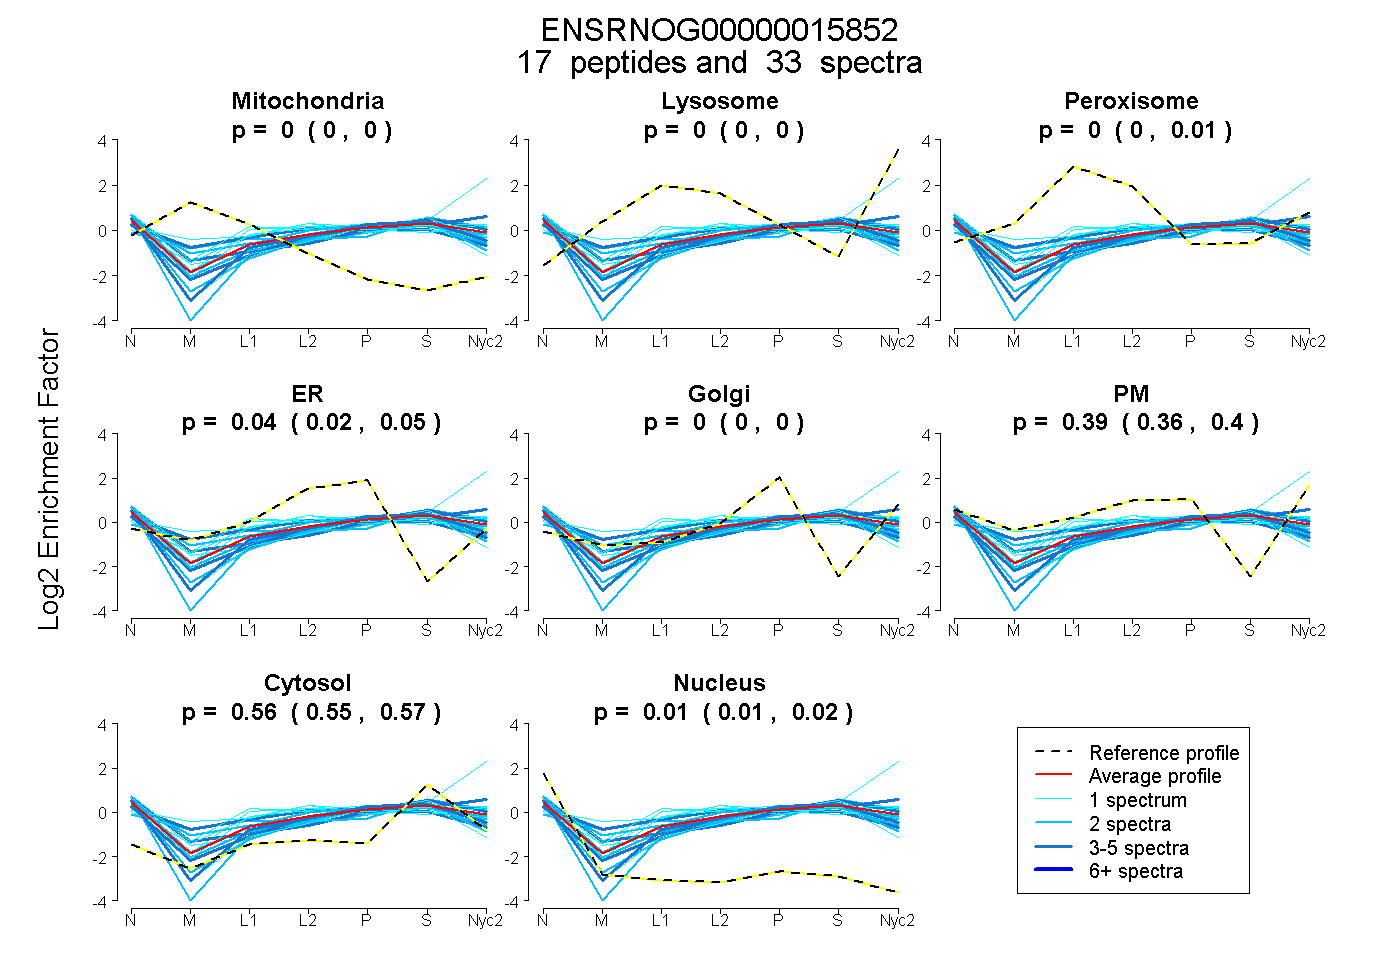
0.000 | 0.000
0.000 | 0.000
0.000 | 0.010
0.021 | 0.055
0.000 | 0.000
0.360 | 0.402
0.553 | 0.565
0.009 | 0.019
6peptides
spectra
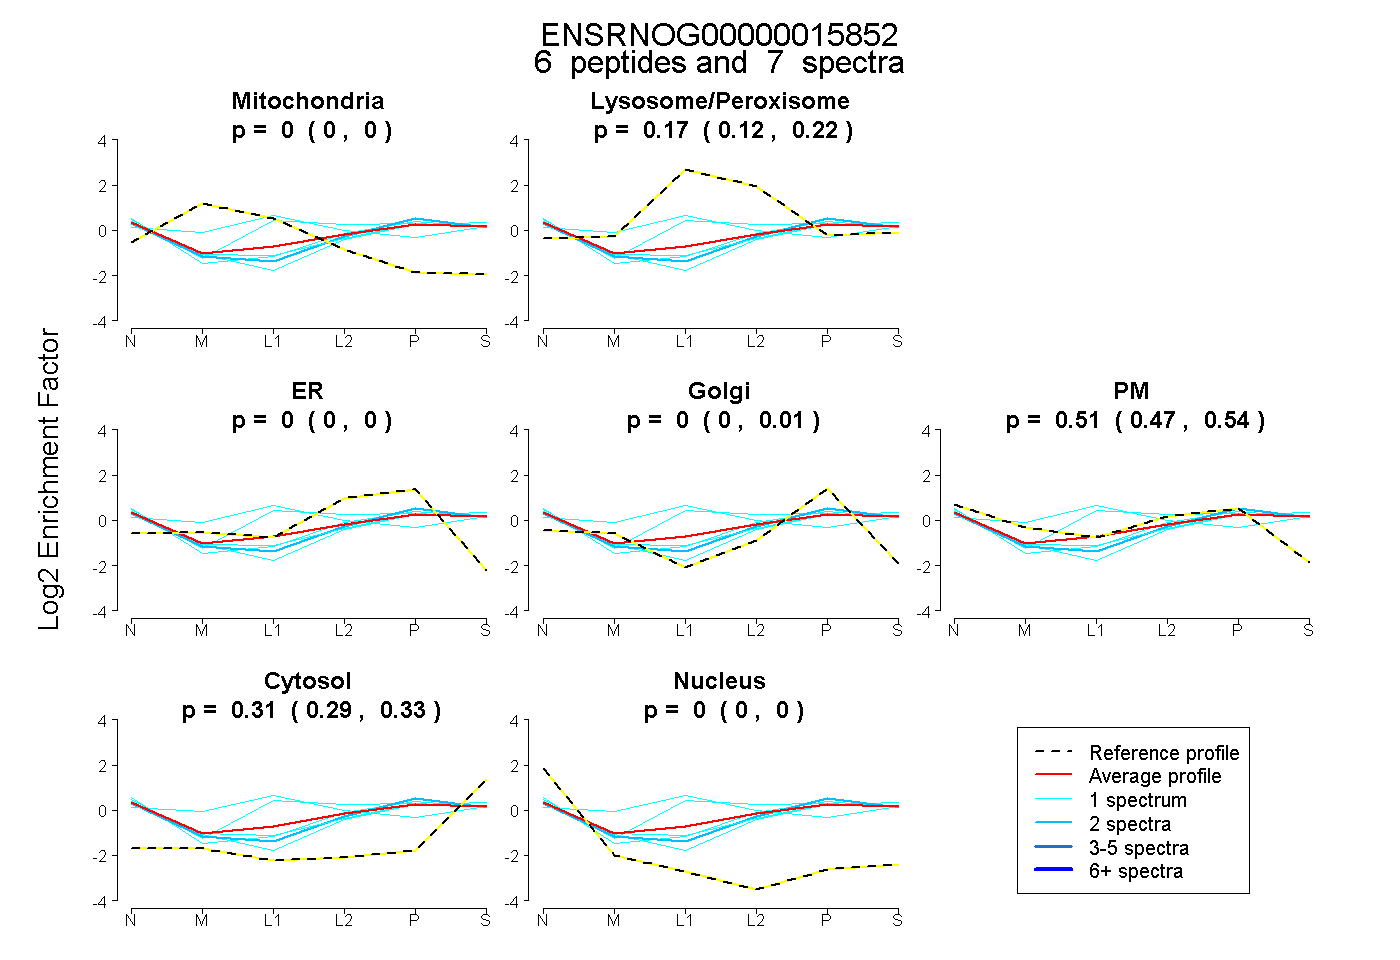
0.000 | 0.000
0.122 | 0.220
0.000 | 0.000
0.000 | 0.011
0.468 | 0.544
0.292 | 0.331
0.000 | 0.000
9peptides
spectra
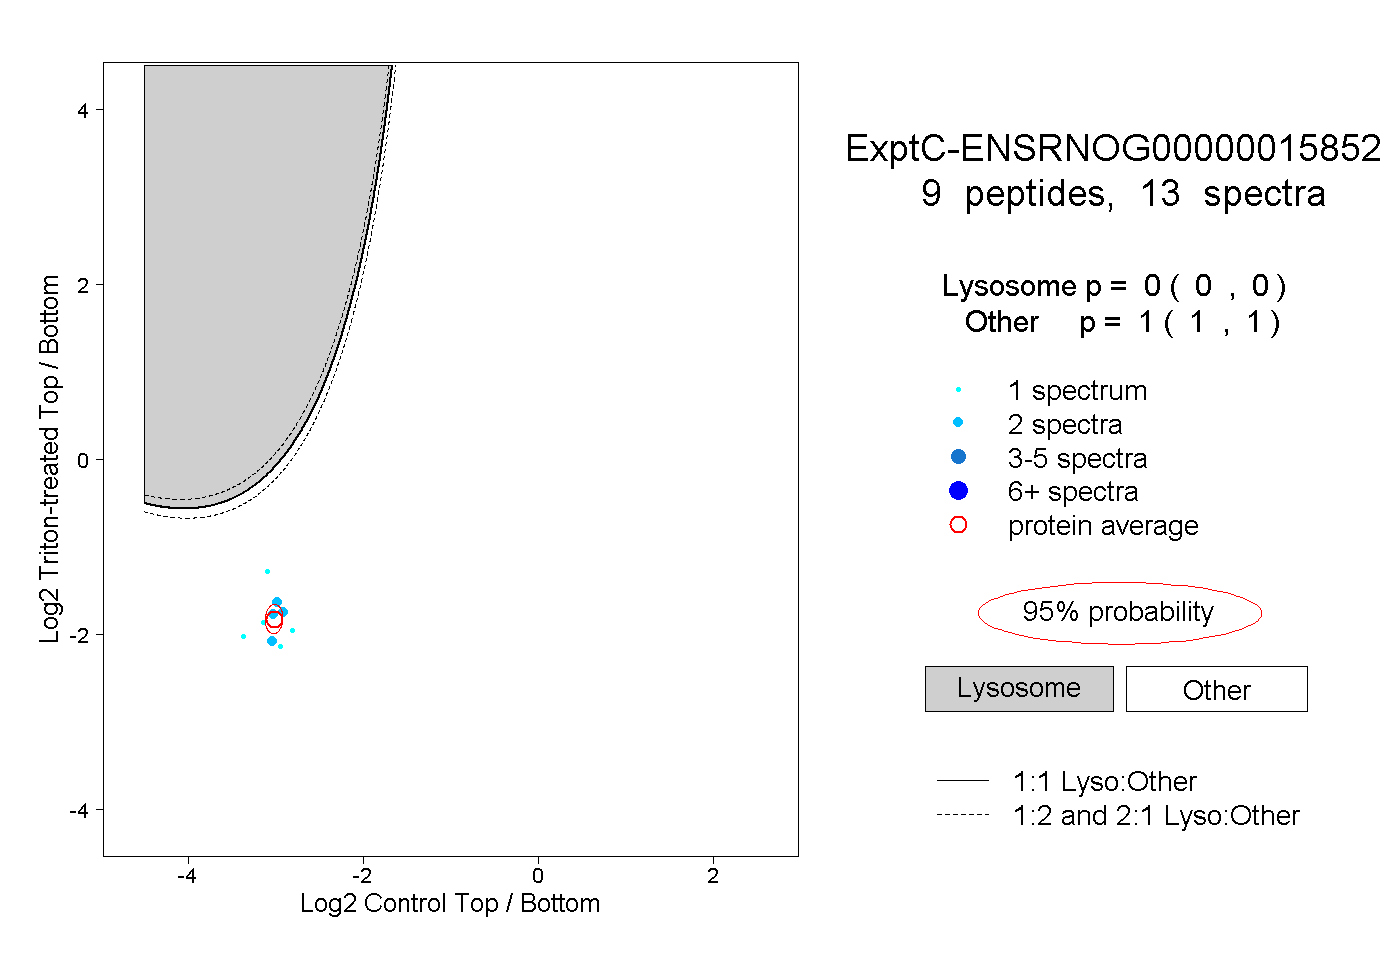
0.000 | 0.000
1.000 | 1.000
1peptide
spectrum
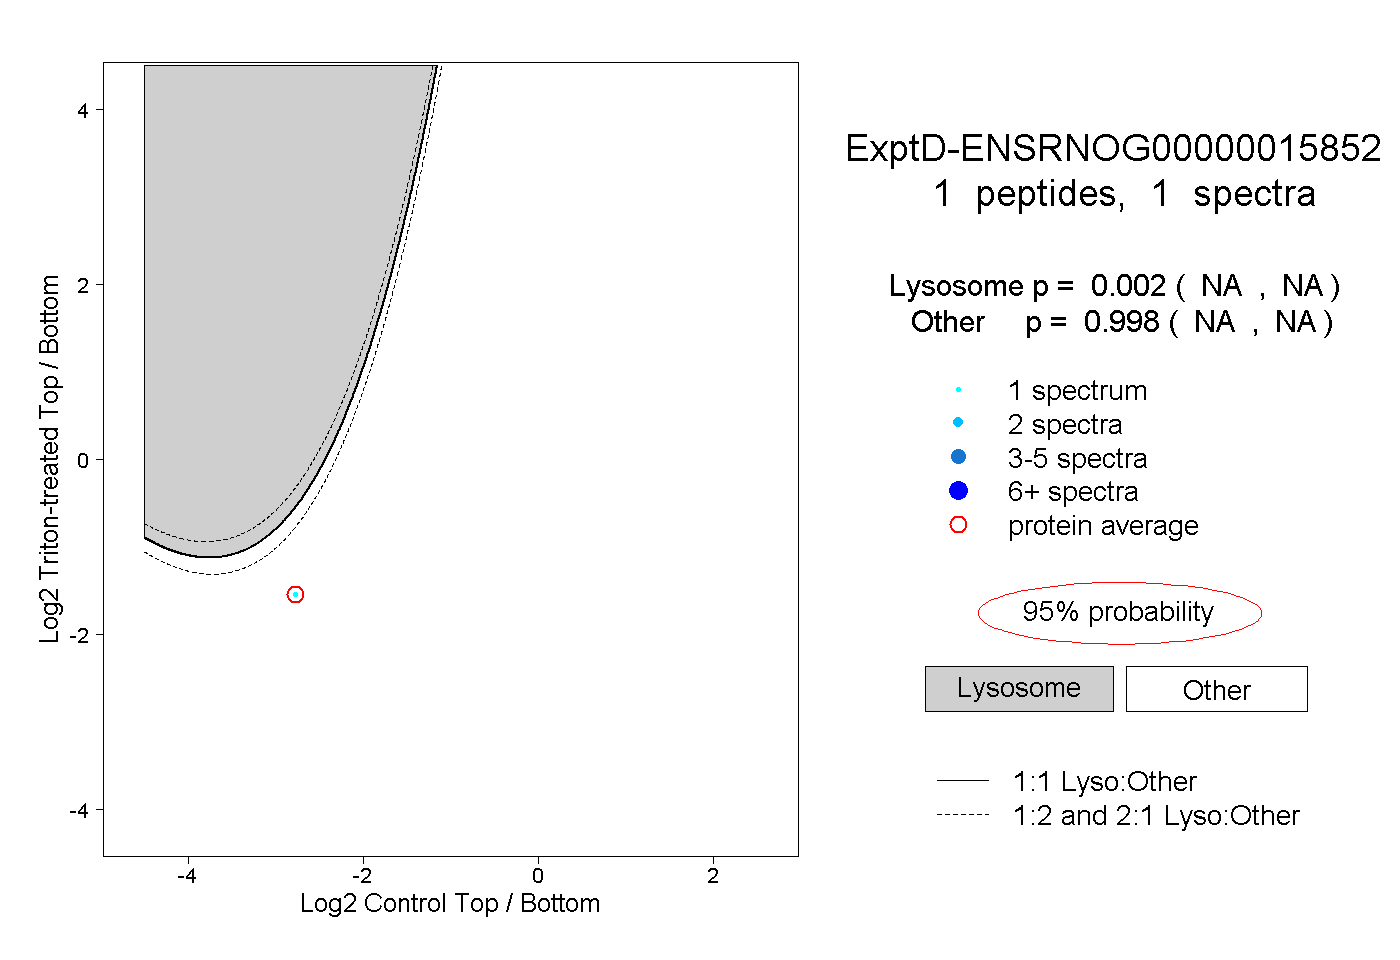
NA | NA
NA | NA