 3
3peptides
spectra
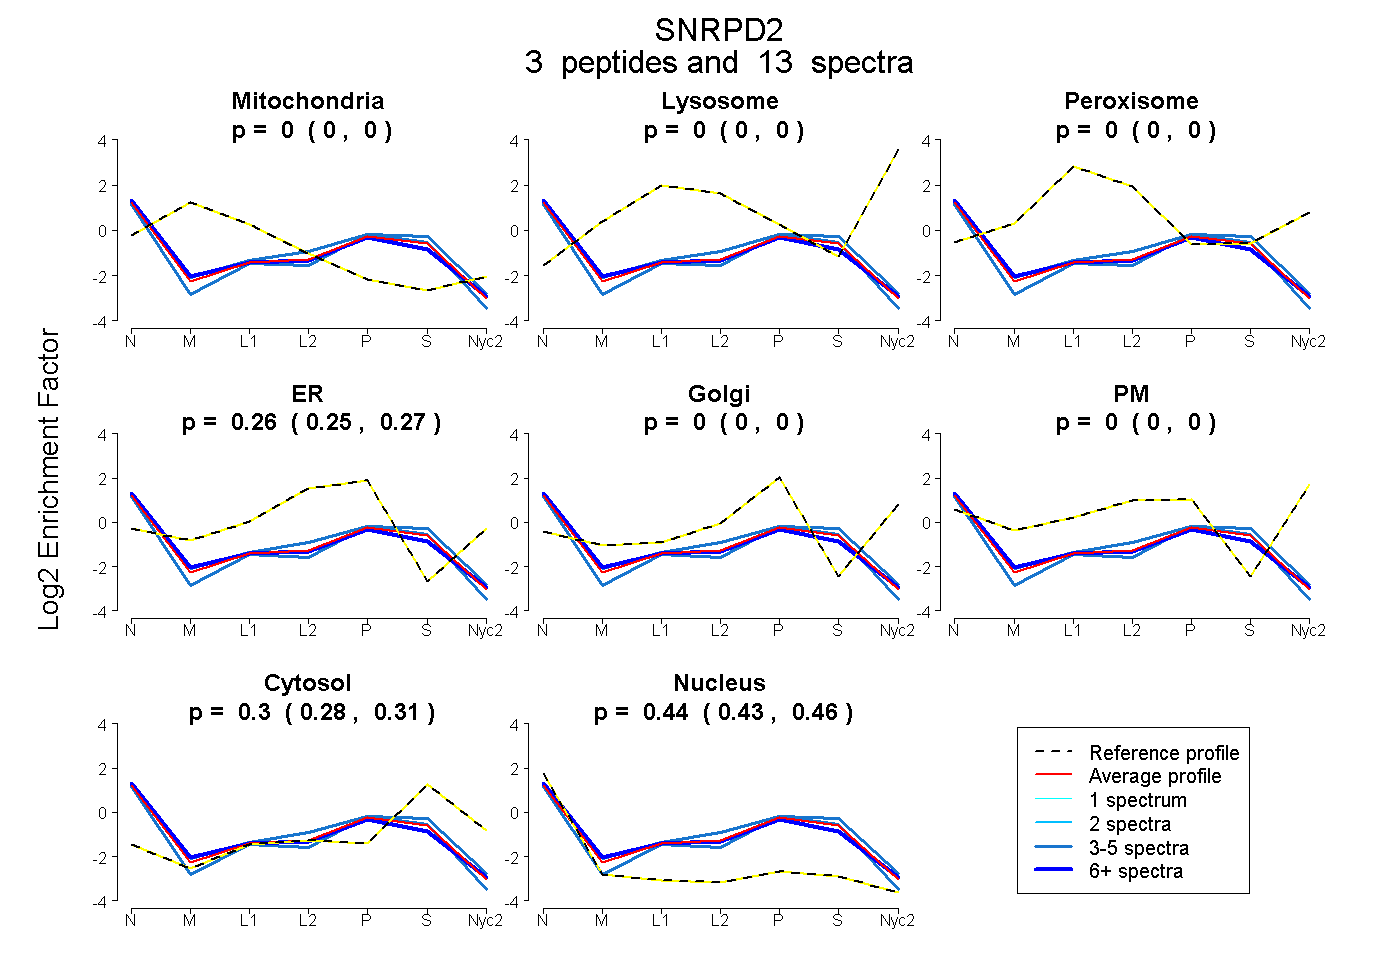
0.000 | 0.000
0.000 | 0.000
0.000 | 0.000
0.246 | 0.271
0.000 | 0.000
0.000 | 0.000
0.278 | 0.313
0.428 | 0.456
4peptides
spectra
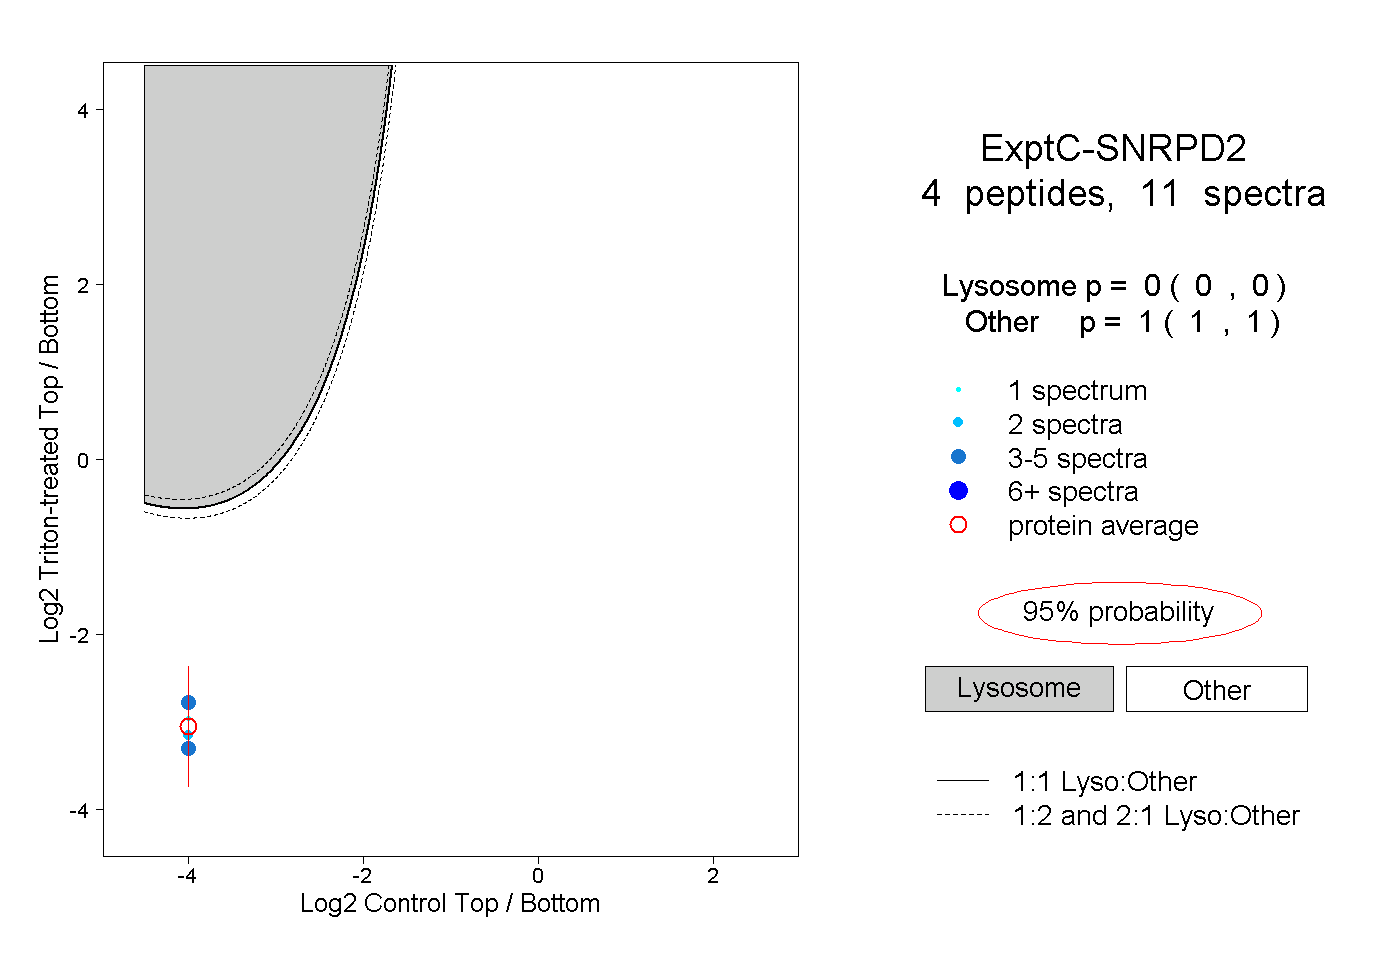
0.000 | 0.000
1.000 | 1.000
1peptide
spectrum
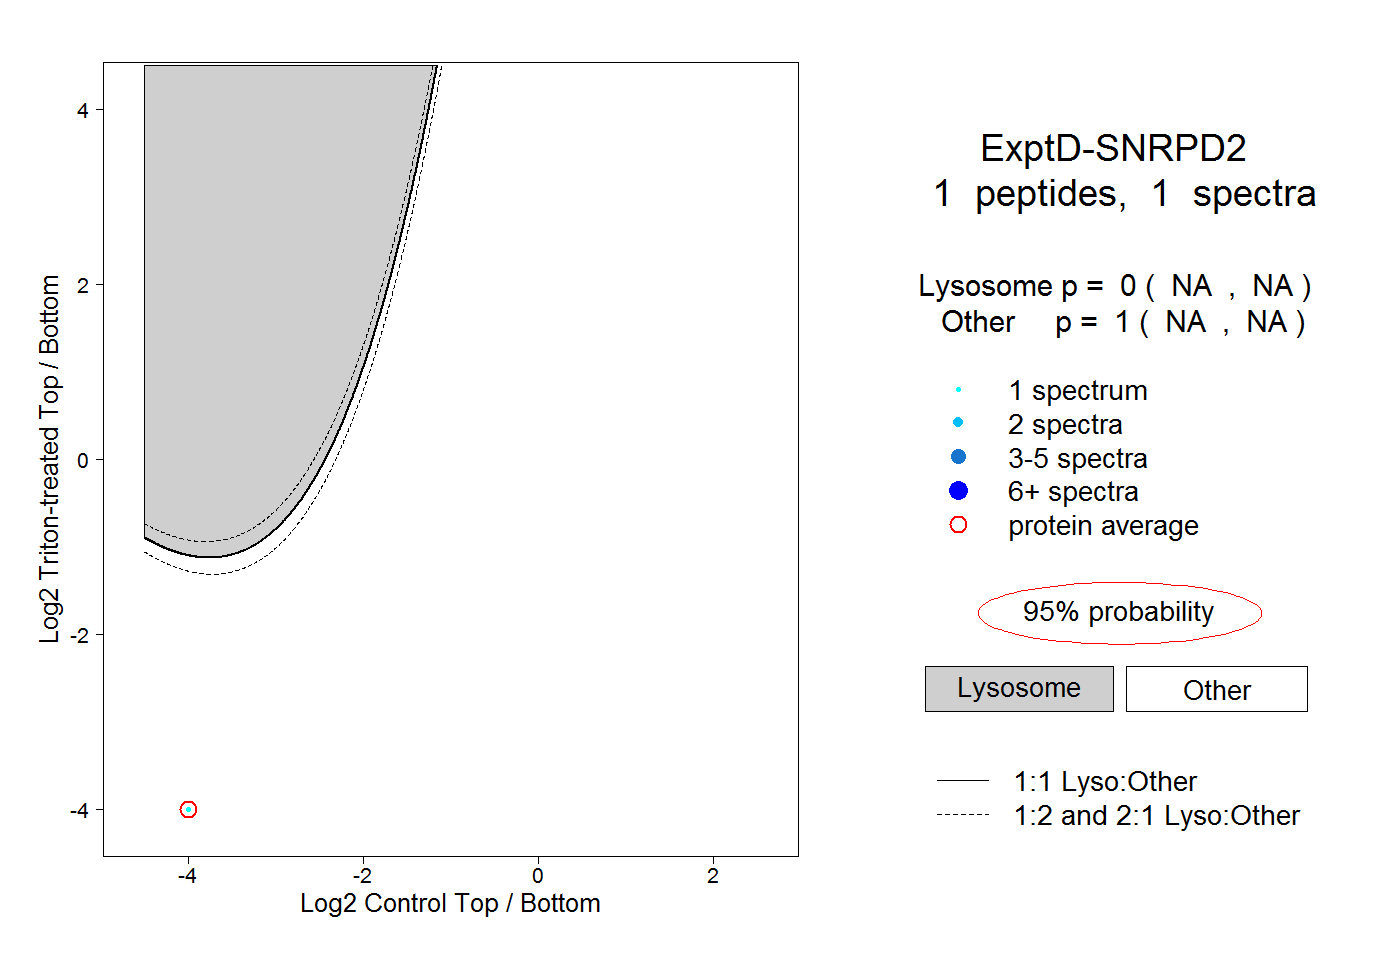
NA | NA
NA | NA