 1
1peptide
spectra
0.000 | 0.000
0.237 | 0.298
0.000 | 0.048
0.000 | 0.068
0.000 | 0.102
0.490 | 0.606
0.045 | 0.112
0.000 | 0.000
2peptides
spectra
0.000 | 0.000
1.000 | 1.000
| Plot | Mito | Lyso | Perox | ER | Golgi | PM | Cytosol | Nucleus | |||||
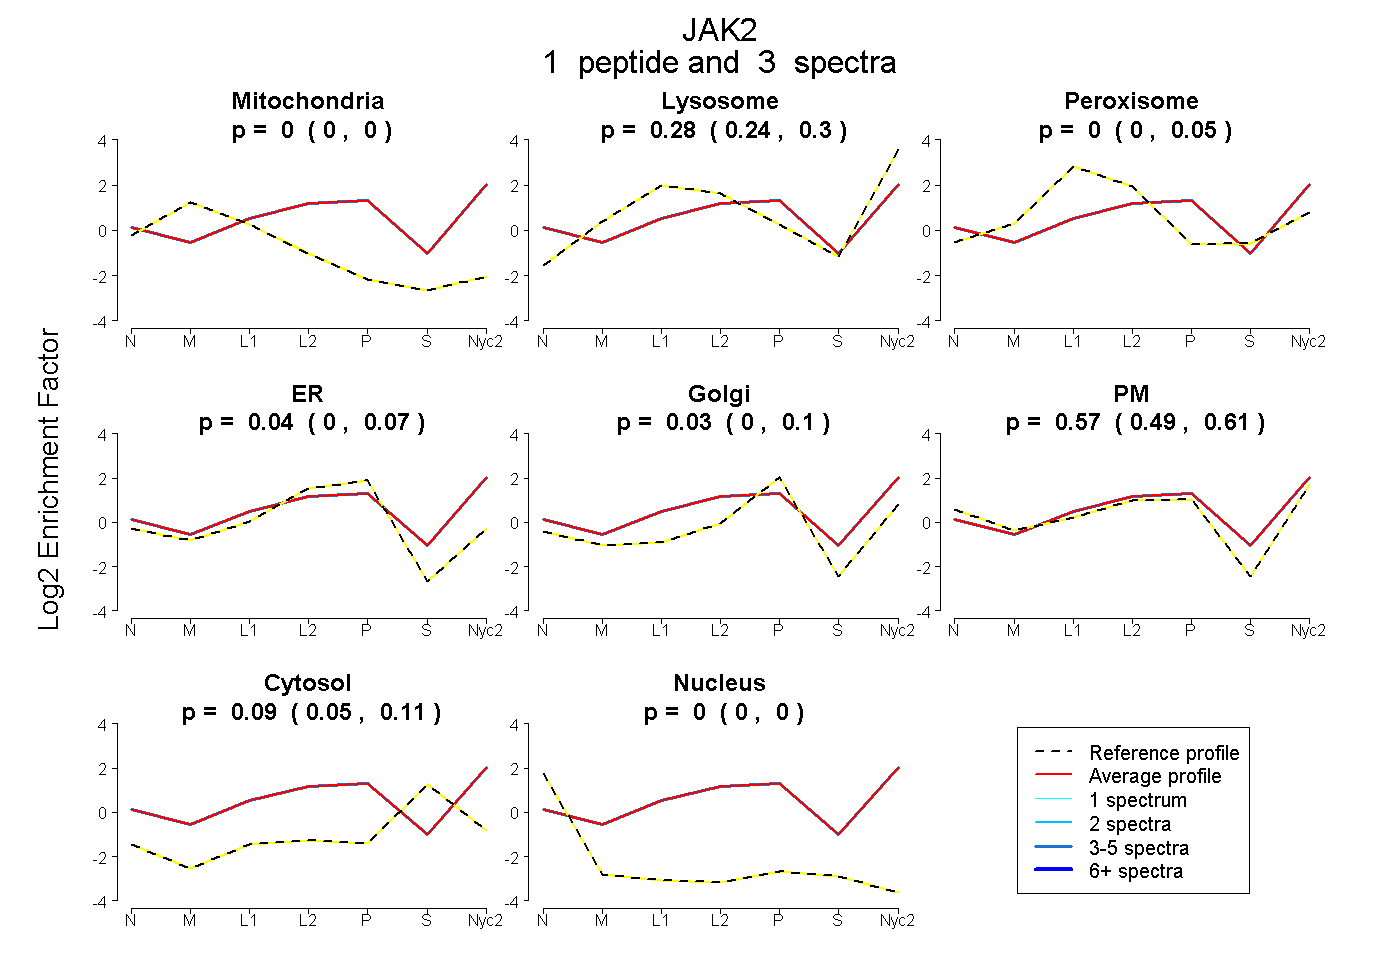
| Expt A |
1 peptide |
3 spectra |
|
0.000 0.000 | 0.000 |
0.276 0.237 | 0.298 |
0.000 0.000 | 0.048 |
0.039 0.000 | 0.068 |
0.032 0.000 | 0.102 |
0.566 0.490 | 0.606 |
0.087 0.045 | 0.112 |
0.000 0.000 | 0.000 |
||
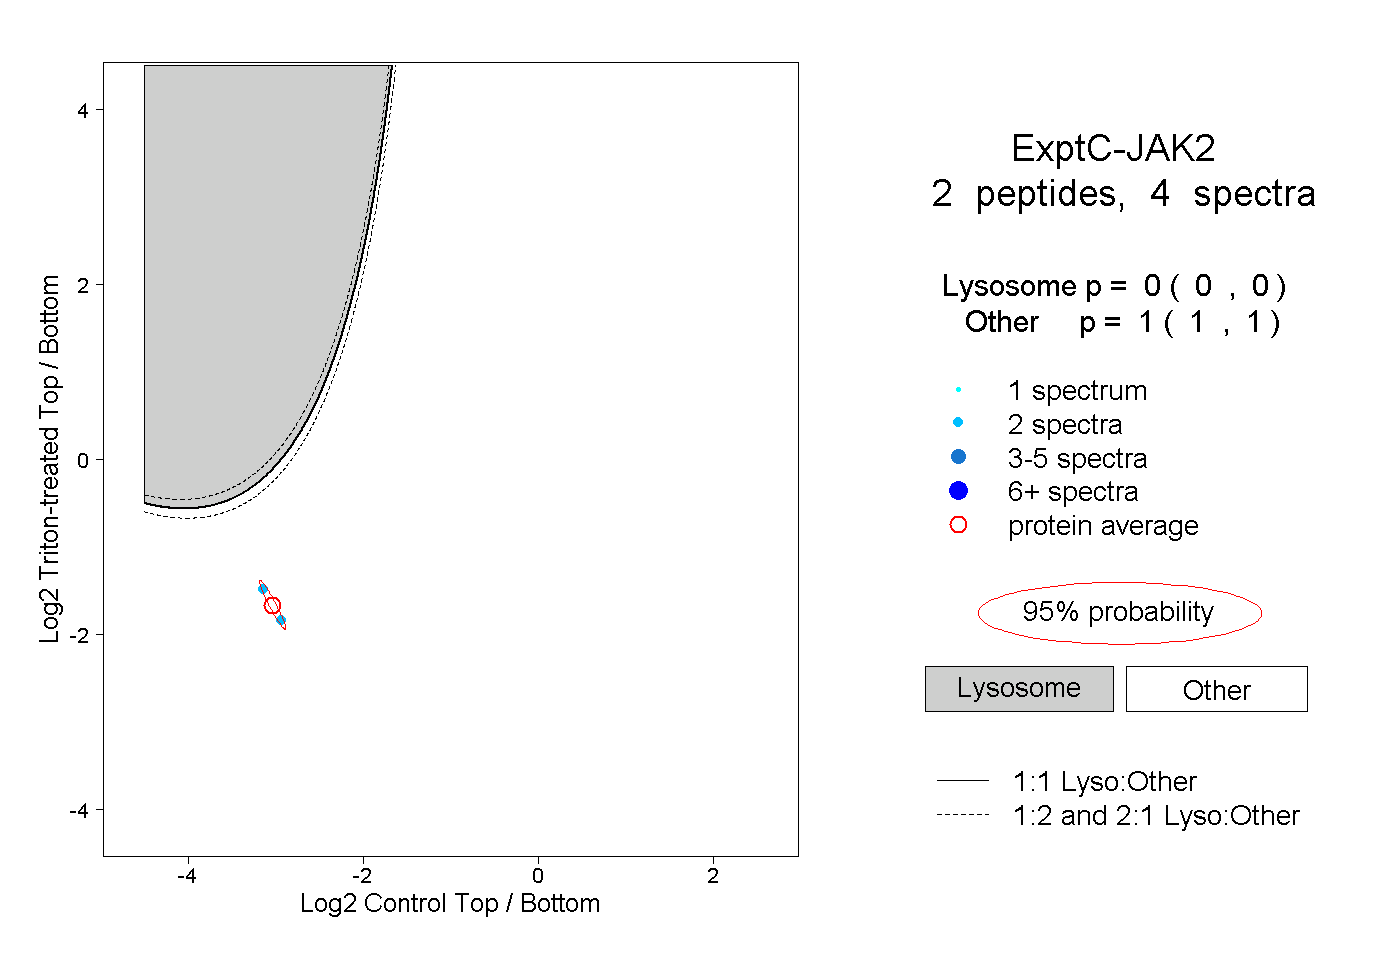
| Plot | Lyso | Other | |||||||||||
| Expt C |
2 peptides |
4 spectra |
|
0.000 0.000 | 0.000 |
1.000 1.000 | 1.000 |