 3
3peptides
spectra
0.000 | 0.000
0.065 | 0.124
0.000 | 0.000
0.000 | 0.000
0.000 | 0.041
0.000 | 0.028
0.858 | 0.907
0.000 | 0.000
1peptide
spectrum
NA | NA
NA | NA
NA | NA
NA | NA
NA | NA
NA | NA
NA | NA
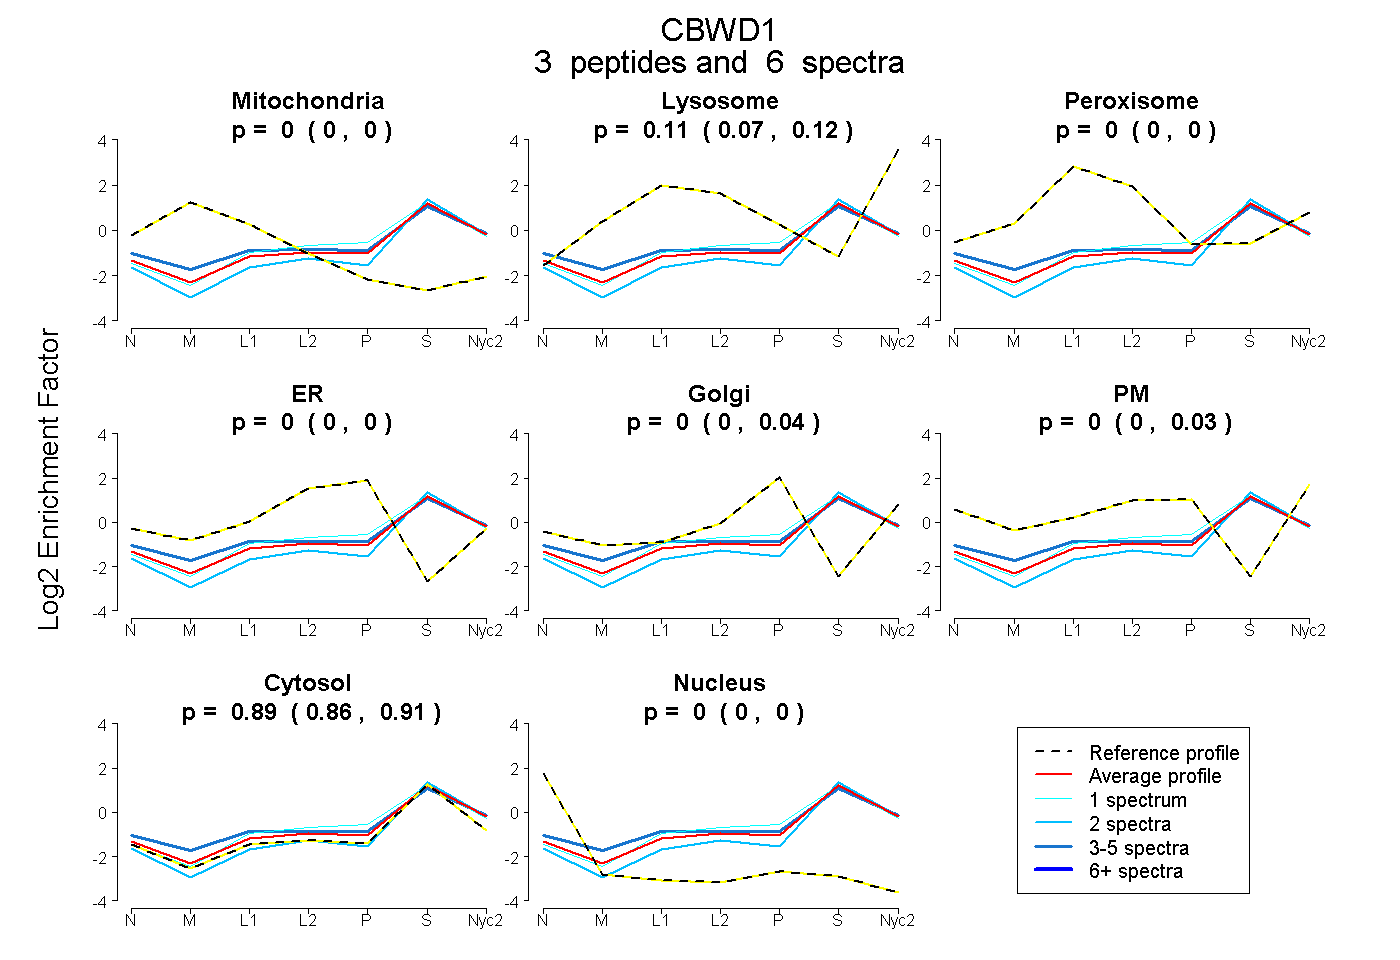
| Plot | Mito | Lyso | Perox | ER | Golgi | PM | Cytosol | Nucleus | |||||
| Expt A |
3 peptides |
6 spectra |
|
0.000 0.000 | 0.000 |
0.106 0.065 | 0.124 |
0.000 0.000 | 0.000 |
0.000 0.000 | 0.000 |
0.005 0.000 | 0.041 |
0.000 0.000 | 0.028 |
0.890 0.858 | 0.907 |
0.000 0.000 | 0.000 |
||
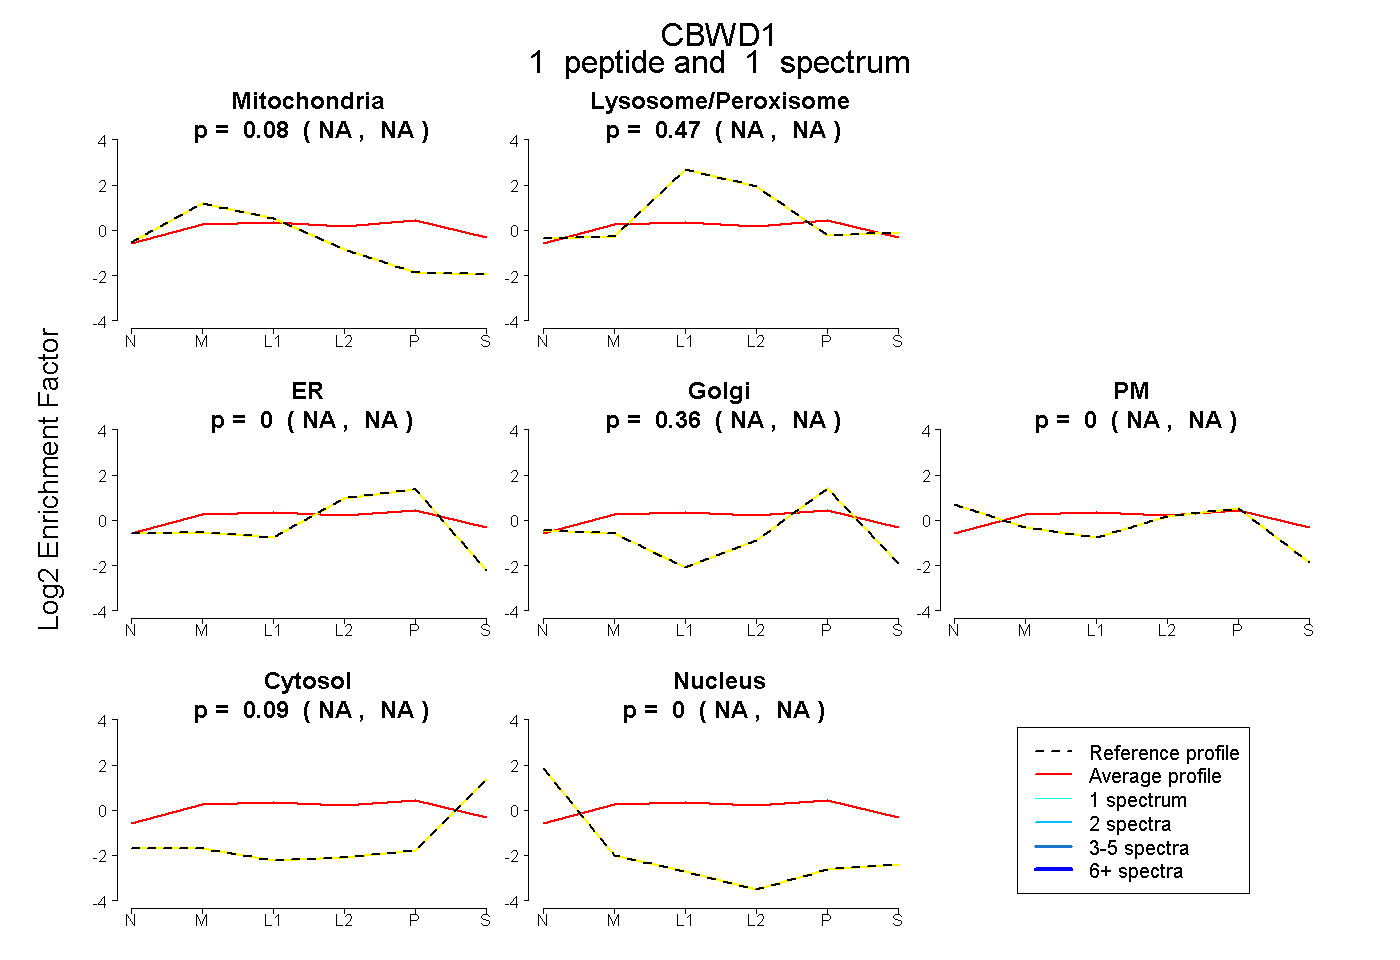
| Plot | Mito | Lyso or Perox | ER | Golgi | PM | Cytosol | Nucleus | ||||||
| Expt B |
1 peptide |
1 spectrum |
|
0.083 NA | NA |
0.468 NA | NA |
0.000 NA | NA |
0.357 NA | NA |
0.000 NA | NA |
0.091 NA | NA |
0.000 NA | NA |