 5
5peptides
spectra
0.000 | 0.000
0.000 | 0.000
0.000 | 0.000
0.000 | 0.000
0.007 | 0.125
0.790 | 0.864
0.017 | 0.133
0.000 | 0.030
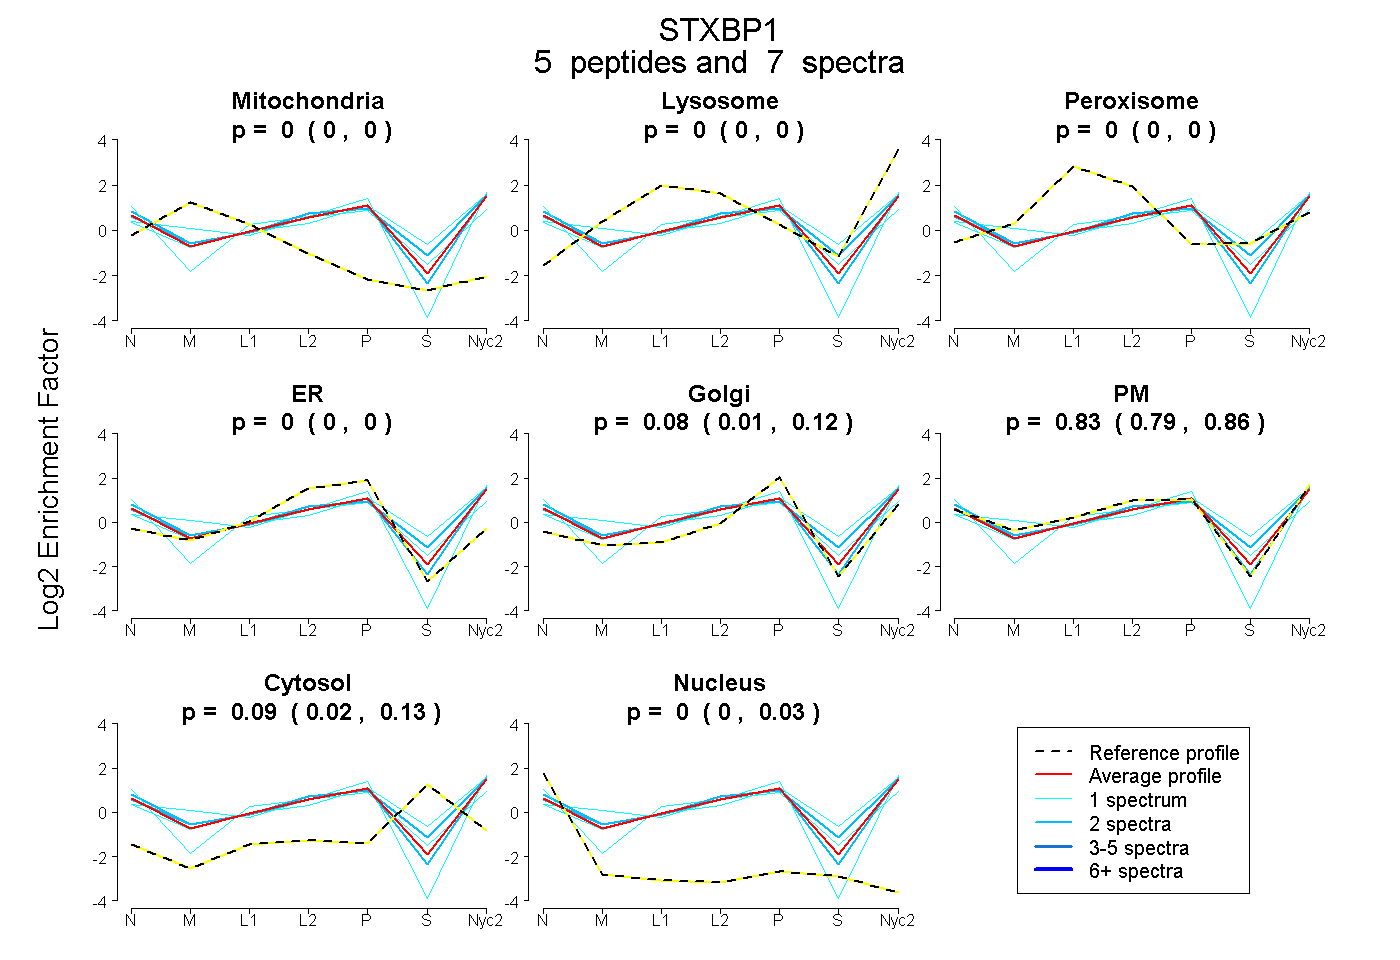
| Plot | Mito | Lyso | Perox | ER | Golgi | PM | Cytosol | Nucleus | |||||
| Expt A |
5 peptides |
7 spectra |
|
0.000 0.000 | 0.000 |
0.000 0.000 | 0.000 |
0.000 0.000 | 0.000 |
0.000 0.000 | 0.000 |
0.077 0.007 | 0.125 |
0.831 0.790 | 0.864 |
0.092 0.017 | 0.133 |
0.000 0.000 | 0.030 |
| 2 spectra, ISEQTYQLSR | 0.000 | 0.000 | 0.000 | 0.000 | 0.068 | 0.890 | 0.000 | 0.042 | ||
| 1 spectrum, SSASFSTTAVSAR | 0.000 | 0.000 | 0.000 | 0.000 | 0.137 | 0.816 | 0.000 | 0.047 | ||
| 2 spectra, YETSGIGEAR | 0.000 | 0.039 | 0.000 | 0.000 | 0.000 | 0.797 | 0.164 | 0.000 | ||
| 1 spectrum, DIMEDTIEDK | 0.000 | 0.106 | 0.000 | 0.000 | 0.057 | 0.612 | 0.225 | 0.000 | ||
| 1 spectrum, HYQGTVDK | 0.074 | 0.000 | 0.051 | 0.000 | 0.118 | 0.657 | 0.100 | 0.000 |
| Plot | Mito | Lyso or Perox | ER | Golgi | PM | Cytosol | Nucleus | ||||||
| Expt B |
1 peptide |
1 spectrum |
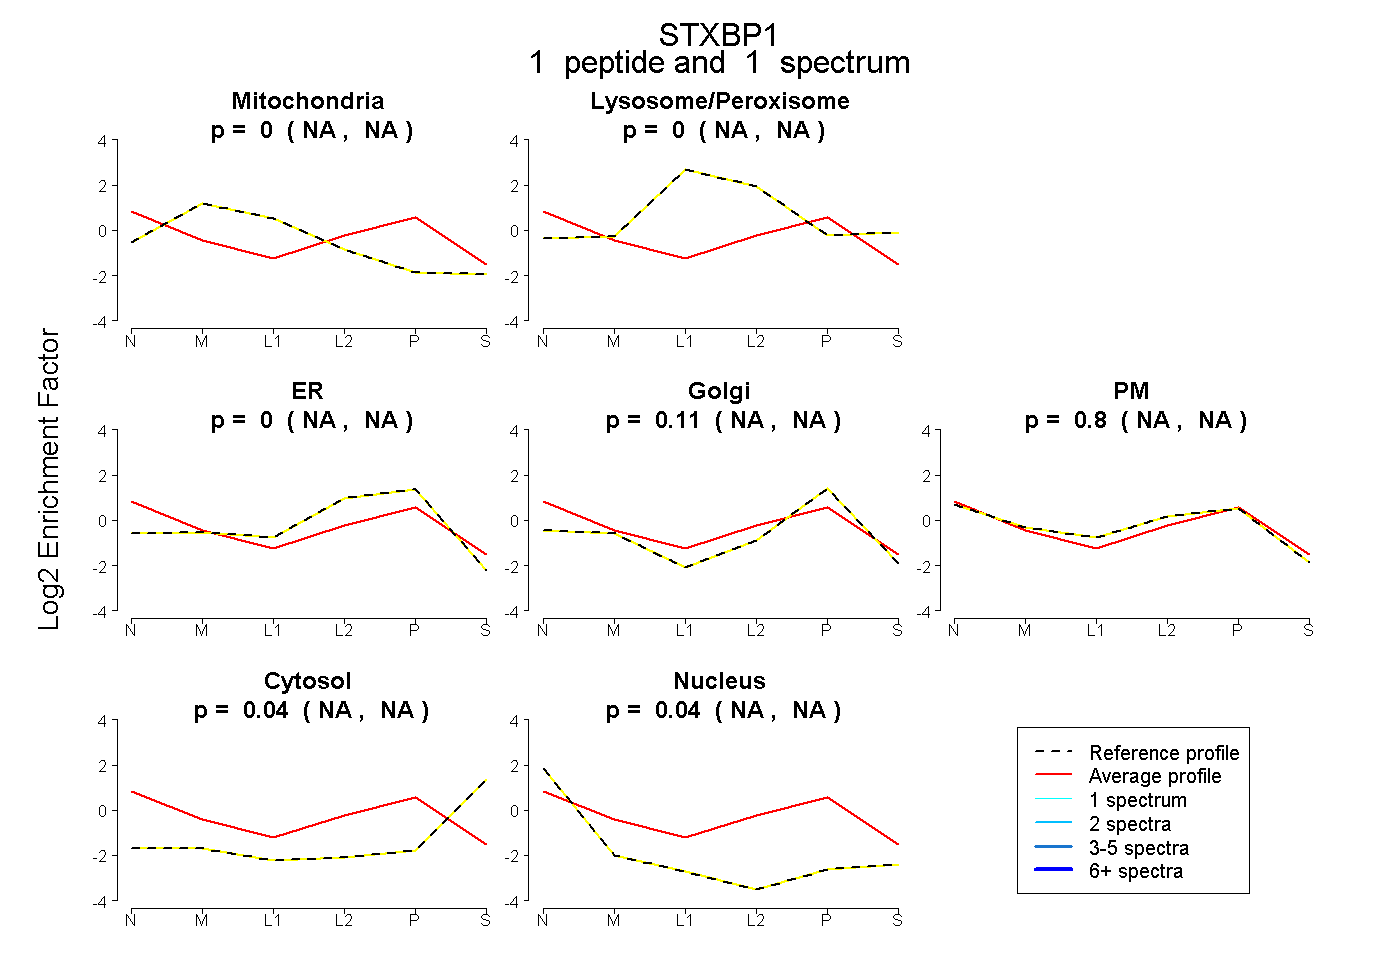 |
0.000 NA | NA |
0.000 NA | NA |
0.000 NA | NA |
0.114 NA | NA |
0.804 NA | NA |
0.039 NA | NA |
0.043 NA | NA |
|||
| Plot | Lyso | Other | |||||||||||
| Expt C |
5 peptides |
8 spectra |
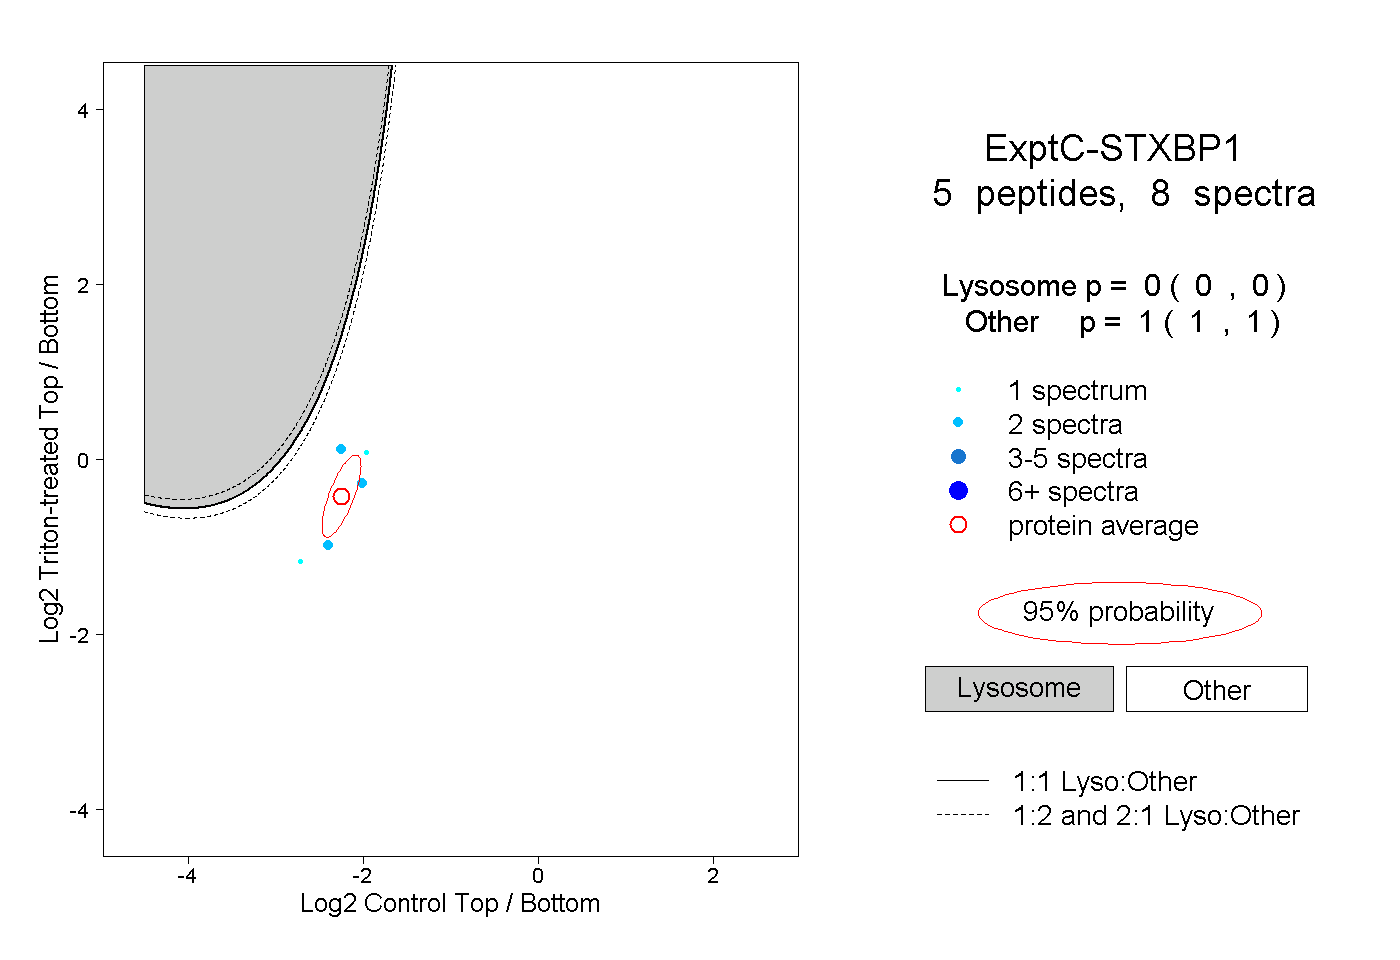 |
0.000 0.000 | 0.000 |
1.000 1.000 | 1.000 |