PPP6C
[ENSRNOP00000021176]
Main page
| | | Plot |
Mito |
Lyso |
|
Perox |
ER |
Golgi |
PM |
Cytosol |
Nucleus |
|
| Expt A |
 8
8
peptides |
13
spectra |
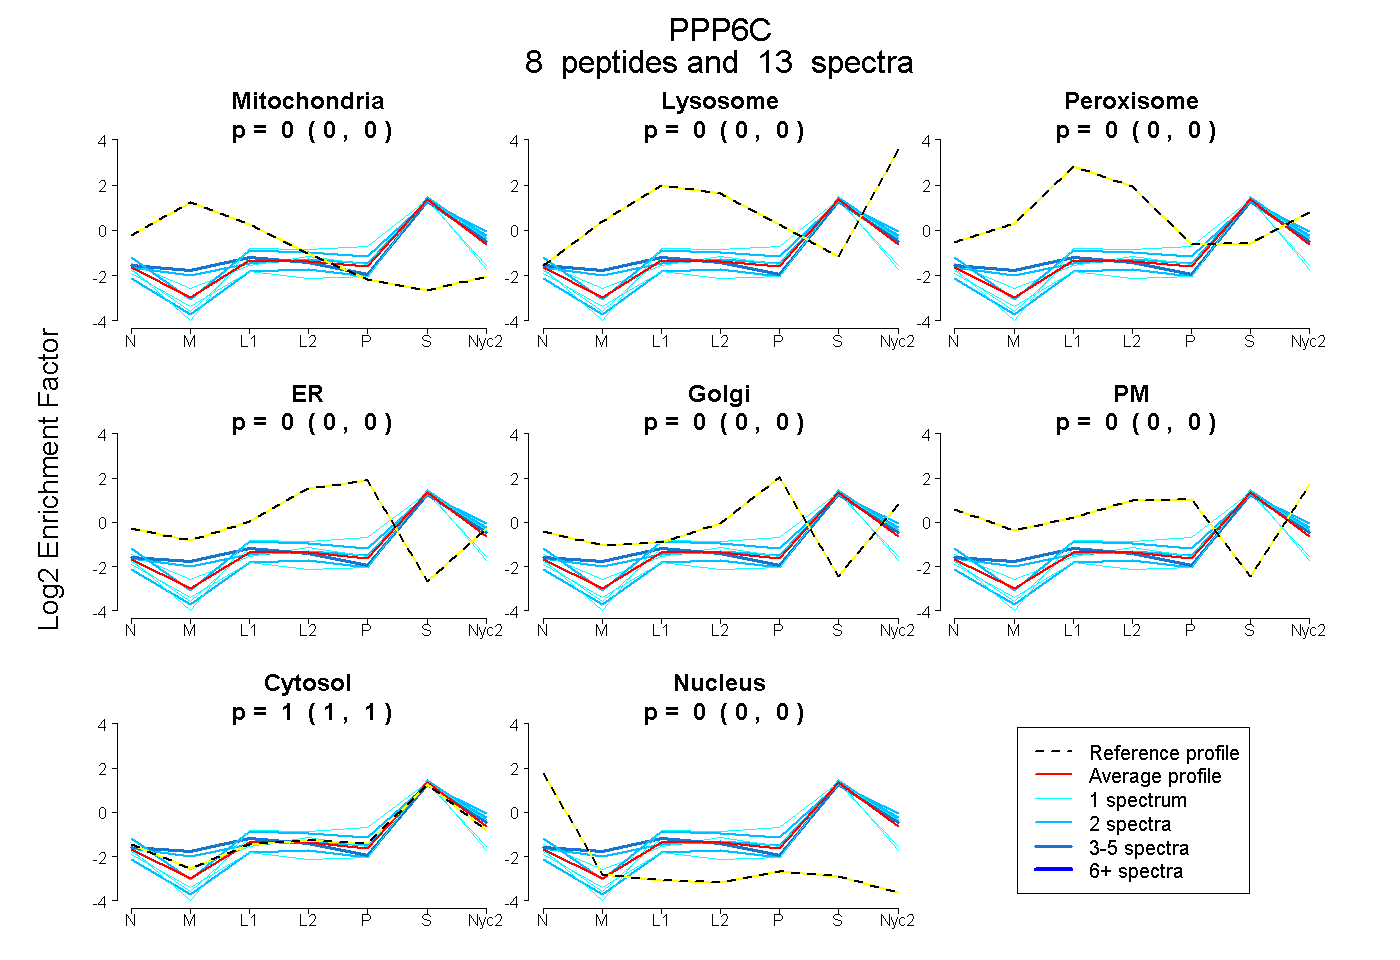 |
0.000
0.000 | 0.000 |
0.000
0.000 | 0.000 |
|
0.000
0.000 | 0.000 |
0.000
0.000 | 0.000 |
0.000
0.000 | 0.000 |
0.000
0.000 | 0.000 |
1.000
1.000 | 1.000 |
0.000
0.000 | 0.000 |
|
| | | Plot |
Mito |
|
Lyso or Perox |
|
ER |
Golgi |
PM |
Cytosol |
Nucleus |
|
| Expt B |
1
peptide |
1
spectrum |
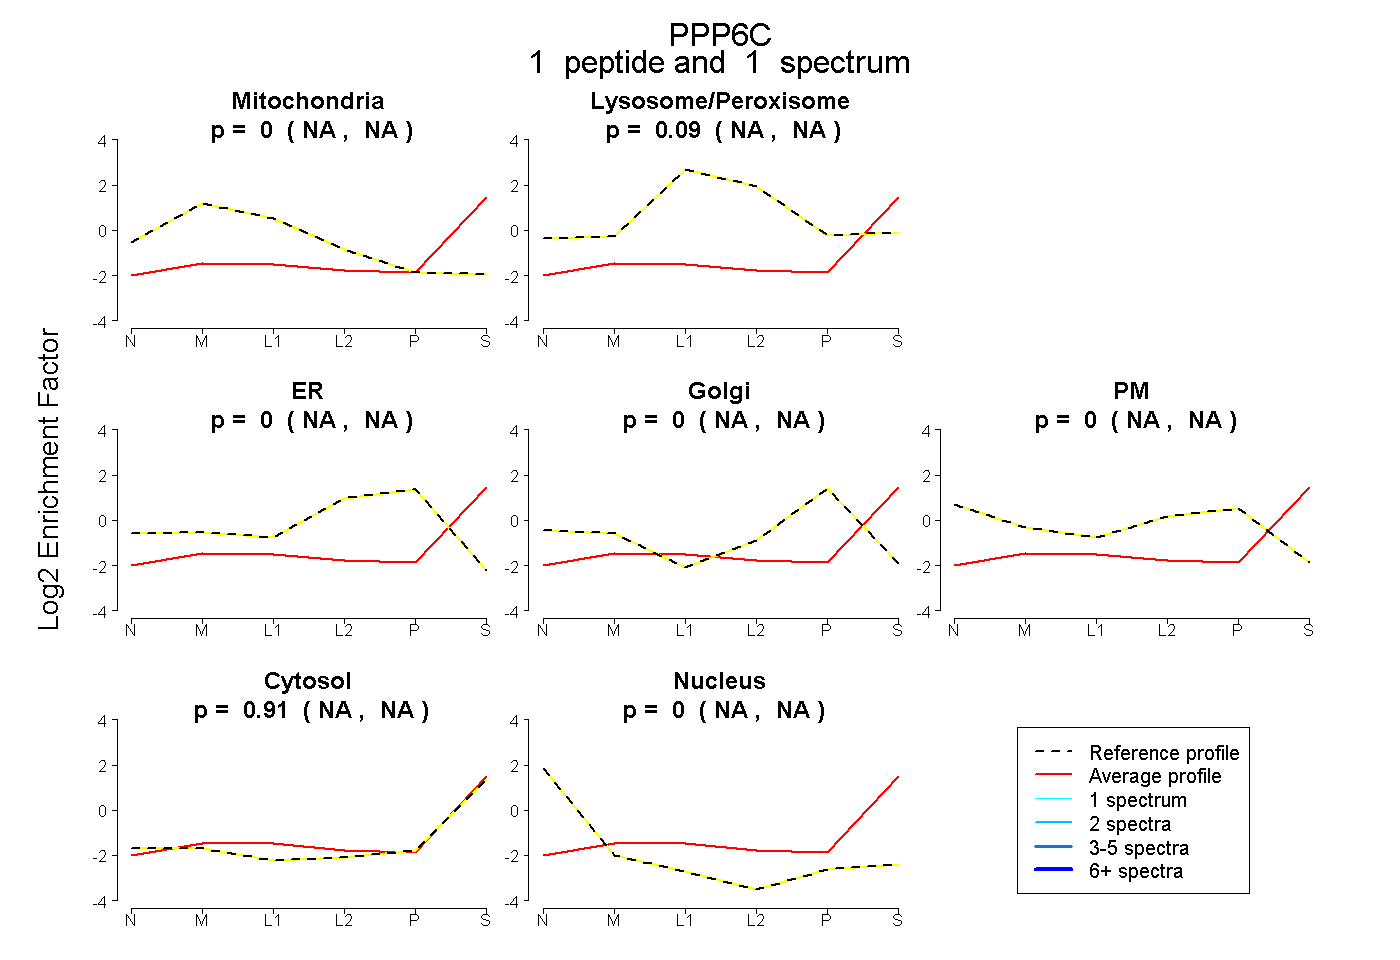 |
0.000
NA | NA |
|
0.090
NA | NA |
|
0.000
NA | NA |
0.000
NA | NA |
0.000
NA | NA |
0.910
NA | NA |
0.000
NA | NA |
|
| | | Plot |
|
Lyso |
|
|
|
|
|
|
|
Other |
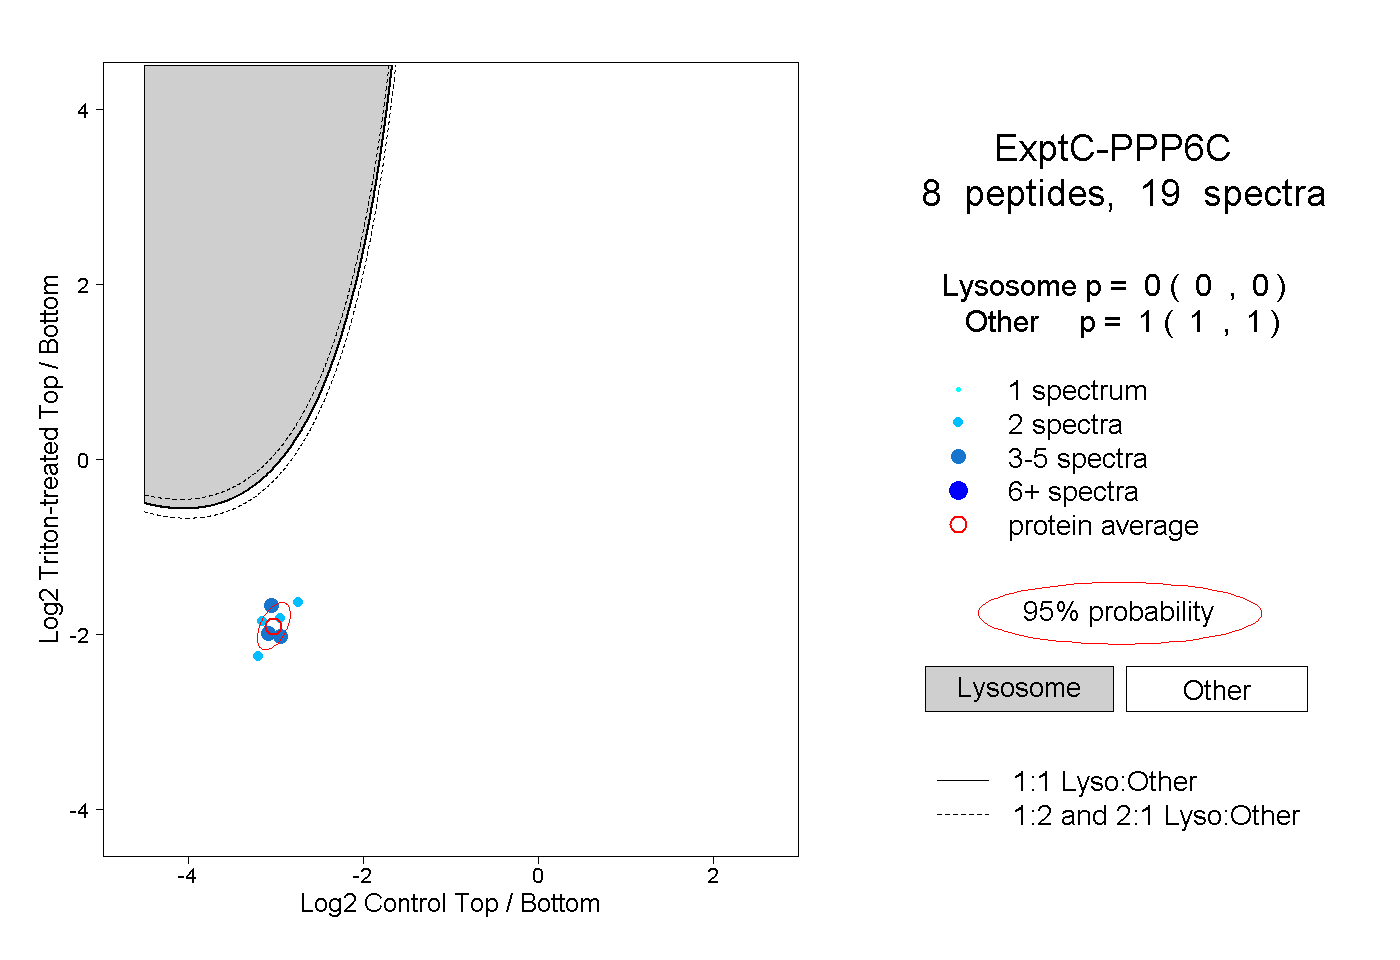
| Expt C |
8
peptides |
19
spectra |
 |
|
0.000
0.000 | 0.000 |
|
|
|
|
|
|
|
1.000
1.000 | 1.000 |
| 2 spectra, YLPENDLK |
|
0.000 |
|
|
|
|
|
|
|
1.000 |
| 2 spectra, APLDLDK |
|
0.000 |
|
|
|
|
|
|
|
1.000 |
| 2 spectra, AHQLVHEGYK |
|
0.000 |
|
|
|
|
|
|
|
1.000 |
| 3 spectra, GAGWLFGAK |
|
0.000 |
|
|
|
|
|
|
|
1.000 |
| 3 spectra, NQEIPHK |
|
0.000 |
|
|
|
|
|
|
|
1.000 |
| 4 spectra, AVPDSER |
|
0.000 |
|
|
|
|
|
|
|
1.000 |
| 1 spectrum, FMFDEK |
|
0.000 |
|
|
|
|
|
|
|
1.000 |
| 2 spectra, VTNEFVHINNLK |
|
0.000 |
|
|
|
|
|
|
|
1.000 |