 16
16peptides
spectra
0.000 | 0.000
0.000 | 0.000
0.000 | 0.000
0.280 | 0.293
0.080 | 0.095
0.596 | 0.608
0.000 | 0.009
0.015 | 0.022
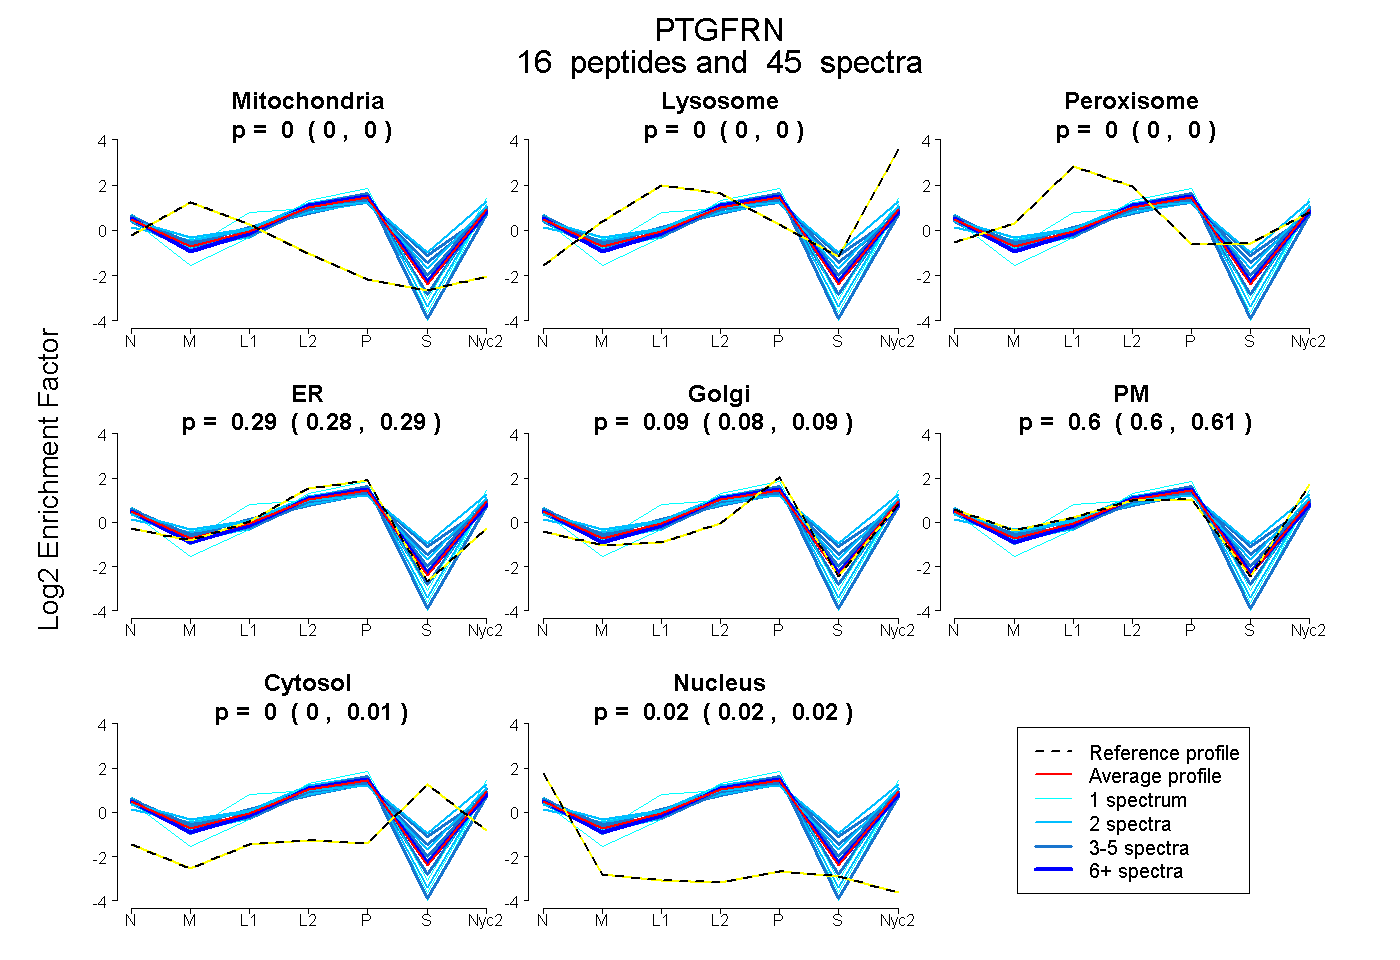
| Plot | Mito | Lyso | Perox | ER | Golgi | PM | Cytosol | Nucleus | |||||
| Expt A |
16 peptides |
45 spectra |
|
0.000 0.000 | 0.000 |
0.000 0.000 | 0.000 |
0.000 0.000 | 0.000 |
0.287 0.280 | 0.293 |
0.090 0.080 | 0.095 |
0.603 0.596 | 0.608 |
0.000 0.000 | 0.009 |
0.021 0.015 | 0.022 |
| 2 spectra, MYQTQVSDAGLYR | 0.000 | 0.000 | 0.000 | 0.366 | 0.007 | 0.628 | 0.000 | 0.000 | ||
| 3 spectra, AQDGEFIFSK | 0.000 | 0.000 | 0.000 | 0.384 | 0.000 | 0.568 | 0.011 | 0.036 | ||
| 2 spectra, YHSGDVR | 0.000 | 0.000 | 0.076 | 0.153 | 0.040 | 0.662 | 0.069 | 0.000 | ||
| 4 spectra, VLADALVVGPSSRPPPGLSLR | 0.000 | 0.000 | 0.000 | 0.463 | 0.040 | 0.471 | 0.000 | 0.027 | ||
| 1 spectrum, EHTDTFSFR | 0.000 | 0.000 | 0.000 | 0.307 | 0.073 | 0.620 | 0.000 | 0.000 | ||
| 3 spectra, EGEPFELR | 0.000 | 0.000 | 0.002 | 0.256 | 0.000 | 0.546 | 0.196 | 0.000 | ||
| 2 spectra, VDGVVLEK | 0.000 | 0.000 | 0.000 | 0.356 | 0.093 | 0.509 | 0.024 | 0.018 | ||
| 1 spectrum, TANDAVELHIK | 0.000 | 0.000 | 0.000 | 0.239 | 0.250 | 0.511 | 0.000 | 0.000 | ||
| 2 spectra, LDTVGSDAYR | 0.000 | 0.000 | 0.000 | 0.294 | 0.141 | 0.550 | 0.000 | 0.015 | ||
| 6 spectra, VQEDEFR | 0.000 | 0.000 | 0.000 | 0.338 | 0.093 | 0.534 | 0.013 | 0.022 | ||
| 2 spectra, TPDTSLLASHMLAR | 0.000 | 0.073 | 0.120 | 0.000 | 0.233 | 0.451 | 0.122 | 0.000 | ||
| 1 spectrum, SPTGSWQR | 0.000 | 0.000 | 0.000 | 0.304 | 0.000 | 0.696 | 0.000 | 0.000 | ||
| 4 spectra, APILLSSLDR | 0.000 | 0.000 | 0.000 | 0.277 | 0.073 | 0.587 | 0.063 | 0.000 | ||
| 4 spectra, STVSLER | 0.000 | 0.000 | 0.032 | 0.169 | 0.109 | 0.649 | 0.006 | 0.035 | ||
| 4 spectra, TVSVTEGK | 0.000 | 0.000 | 0.000 | 0.283 | 0.000 | 0.567 | 0.151 | 0.000 | ||
| 4 spectra, GVVTTGQR | 0.000 | 0.000 | 0.000 | 0.289 | 0.037 | 0.655 | 0.000 | 0.019 |
| Plot | Mito | Lyso or Perox | ER | Golgi | PM | Cytosol | Nucleus | ||||||
| Expt B |
7 peptides |
13 spectra |
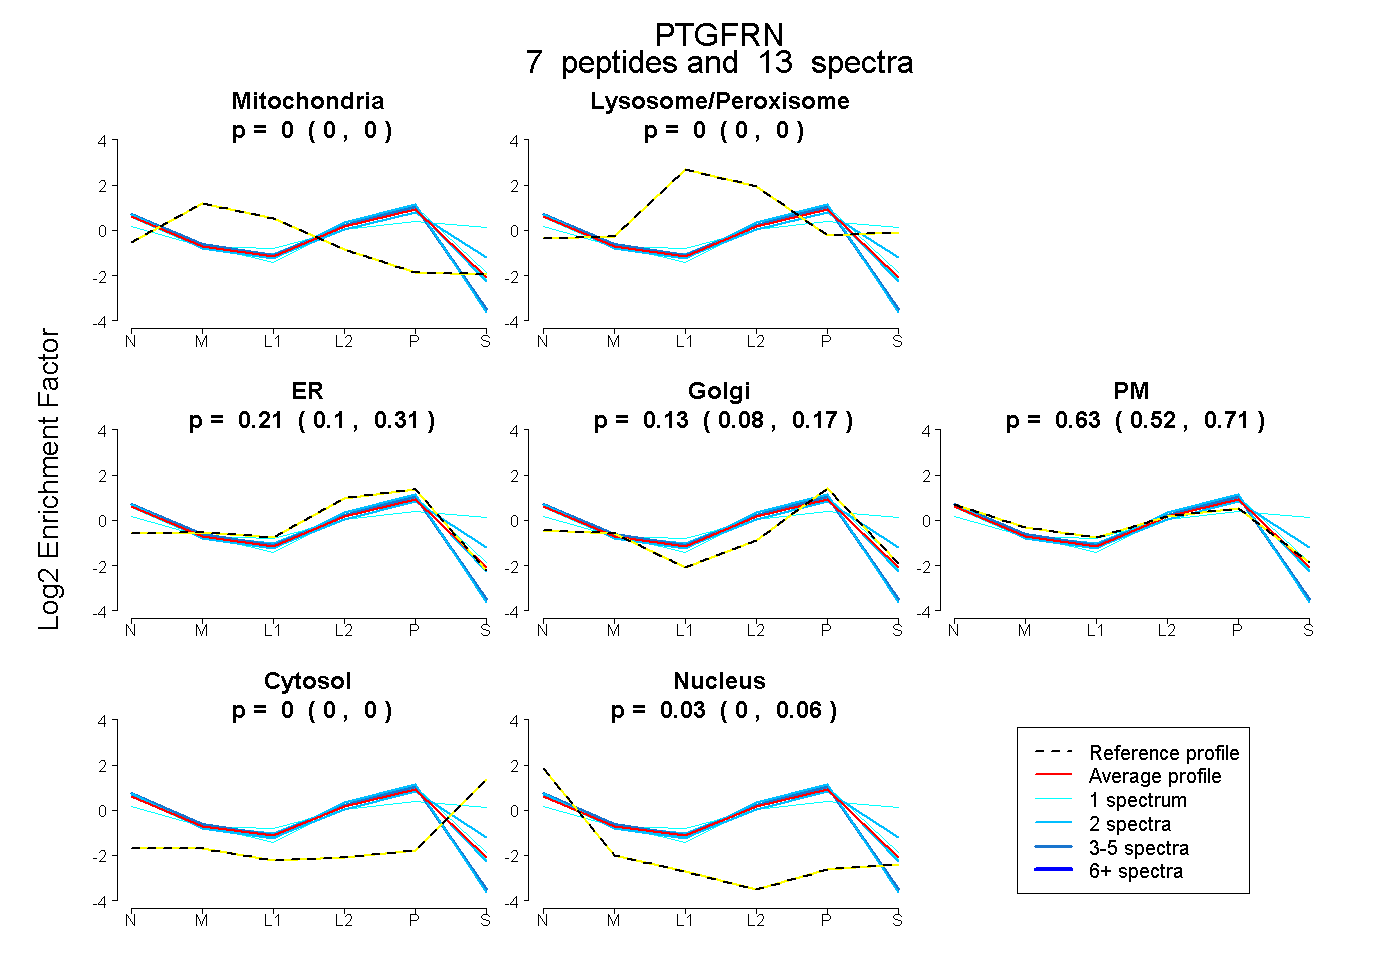 |
0.000 0.000 | 0.000 |
0.000 0.000 | 0.000 |
0.214 0.098 | 0.310 |
0.126 0.076 | 0.169 |
0.626 0.522 | 0.712 |
0.000 0.000 | 0.000 |
0.035 0.000 | 0.063 |
|||
| Plot | Lyso | Other | |||||||||||
| Expt C |
22 peptides |
77 spectra |
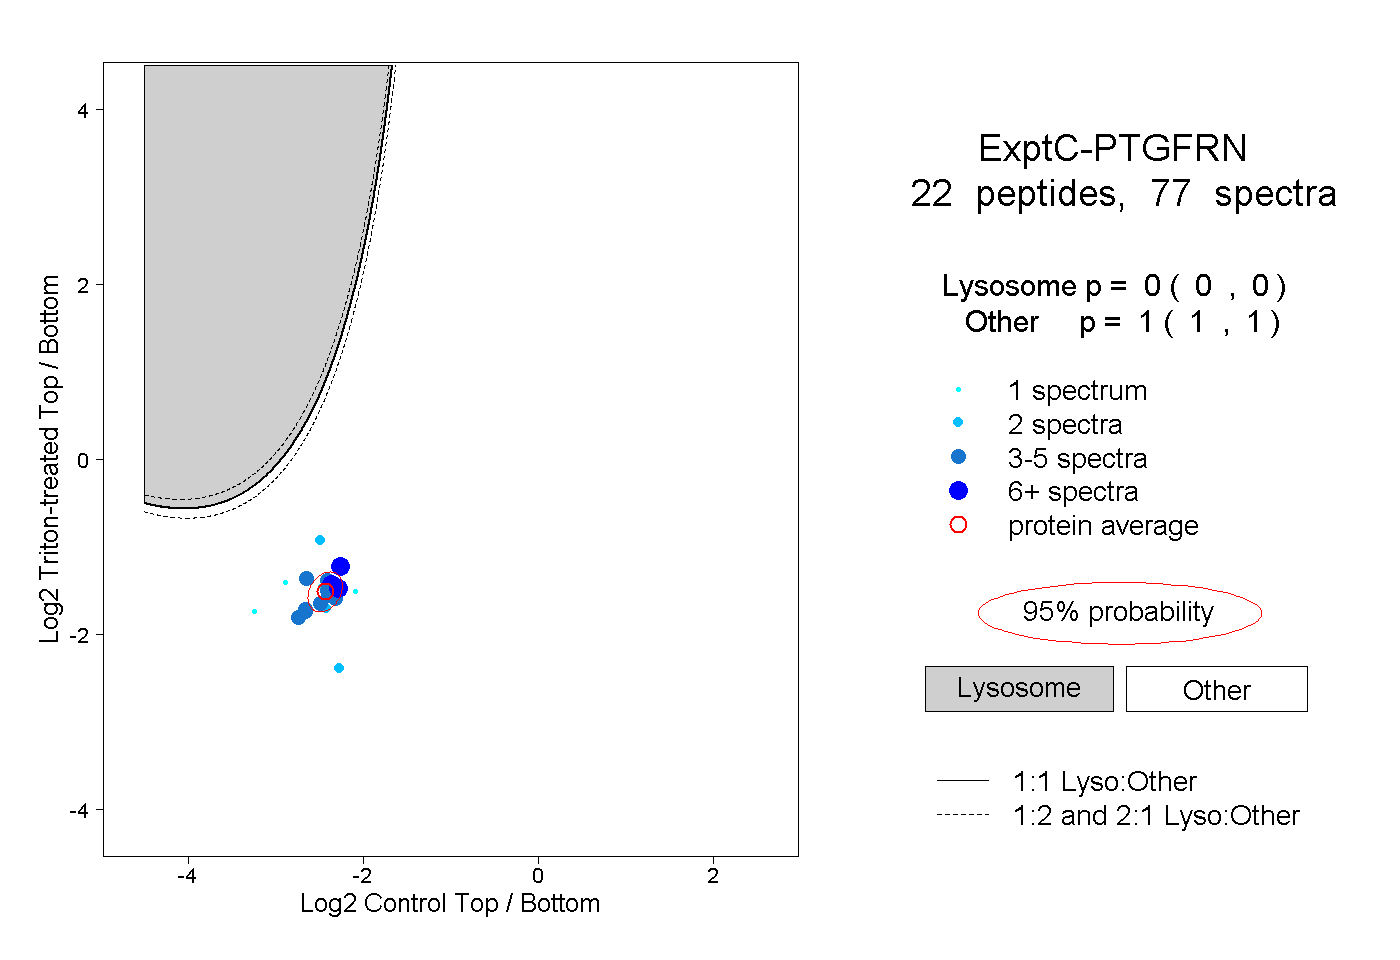 |
0.000 0.000 | 0.000 |
1.000 1.000 | 1.000 |
||||||||
| Plot | Lyso | Other | |||||||||||
| Expt D |
4 peptides |
7 spectra |
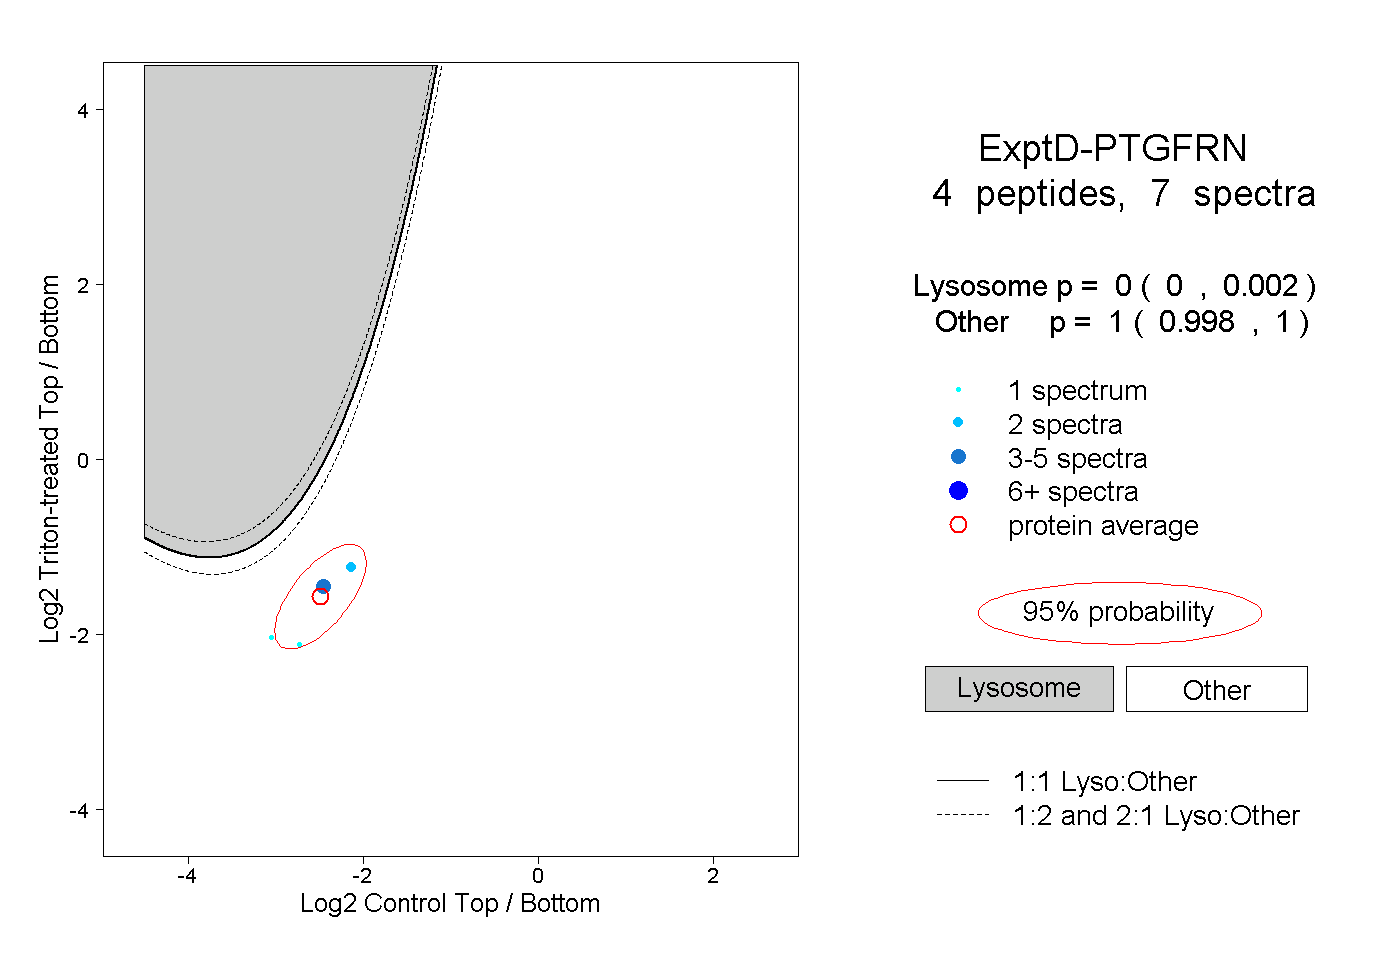 |
0.000 0.000 | 0.002 |
1.000 0.998 | 1.000 |