 4
4peptides
spectra
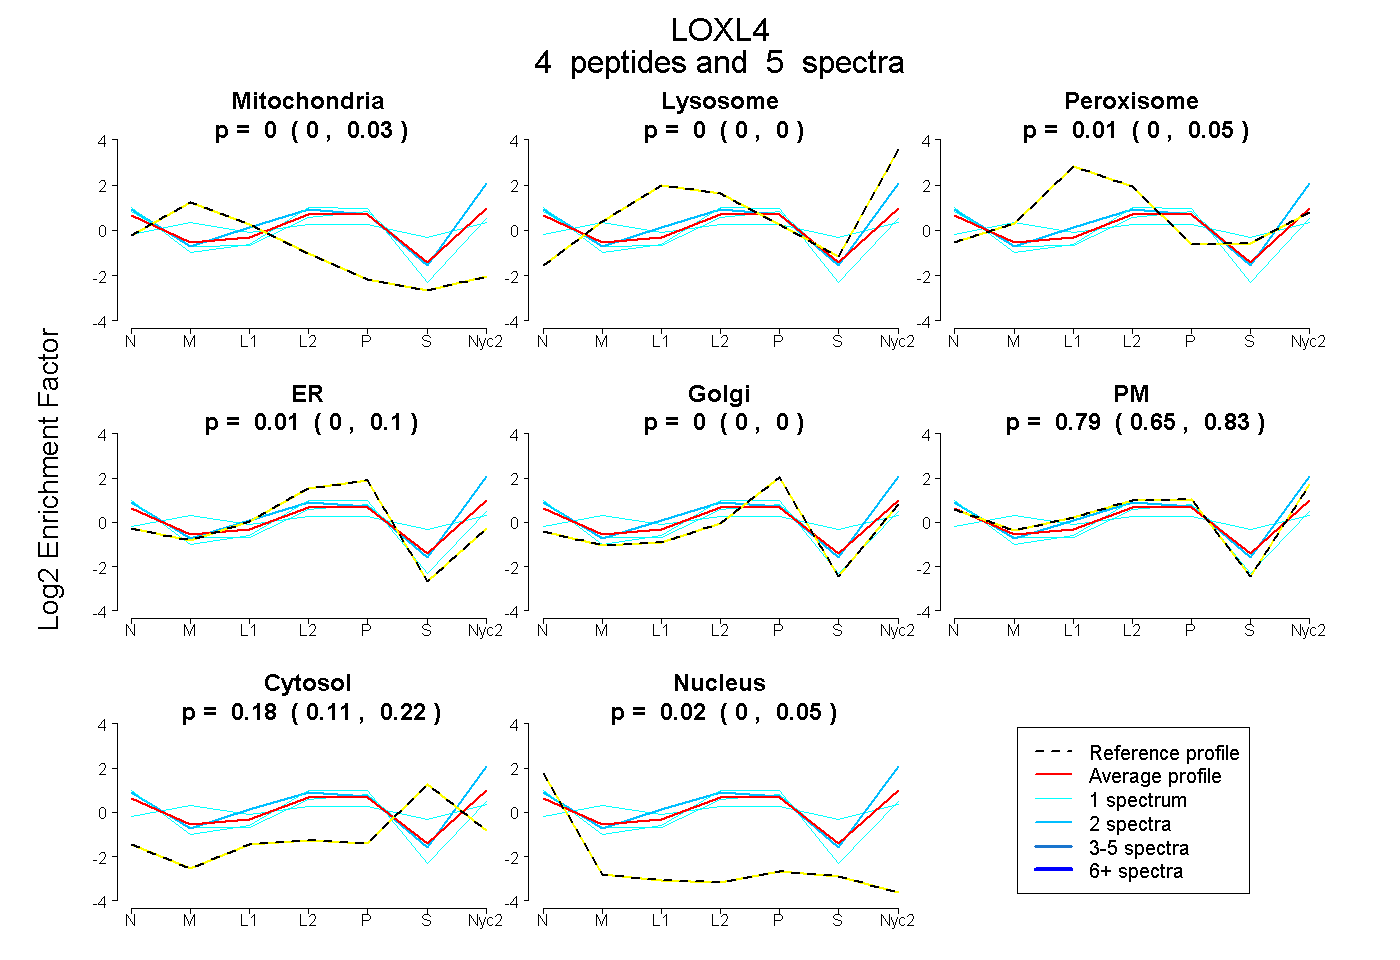
0.000 | 0.028
0.000 | 0.000
0.000 | 0.052
0.000 | 0.100
0.000 | 0.000
0.646 | 0.834
0.106 | 0.217
0.000 | 0.054
| Plot | Mito | Lyso | Perox | ER | Golgi | PM | Cytosol | Nucleus | |||||
| Expt A |
4 peptides |
5 spectra |
|
0.000 0.000 | 0.028 |
0.000 0.000 | 0.000 |
0.007 0.000 | 0.052 |
0.010 0.000 | 0.100 |
0.000 0.000 | 0.000 |
0.790 0.646 | 0.834 |
0.177 0.106 | 0.217 |
0.017 0.000 | 0.054 |
| 1 spectrum, HSEDVGVVCHPR | 0.113 | 0.030 | 0.237 | 0.000 | 0.157 | 0.221 | 0.241 | 0.000 | ||
| 1 spectrum, SGAQVGEGR | 0.000 | 0.000 | 0.000 | 0.000 | 0.030 | 0.770 | 0.153 | 0.048 | ||
| 1 spectrum, VSNALGPQGR | 0.000 | 0.000 | 0.000 | 0.264 | 0.000 | 0.610 | 0.000 | 0.126 | ||
| 2 spectra, VAEGHK | 0.000 | 0.063 | 0.000 | 0.000 | 0.000 | 0.854 | 0.083 | 0.000 |
| Plot | Lyso | Other | |||||||||||
| Expt C |
1 peptide |
1 spectrum |
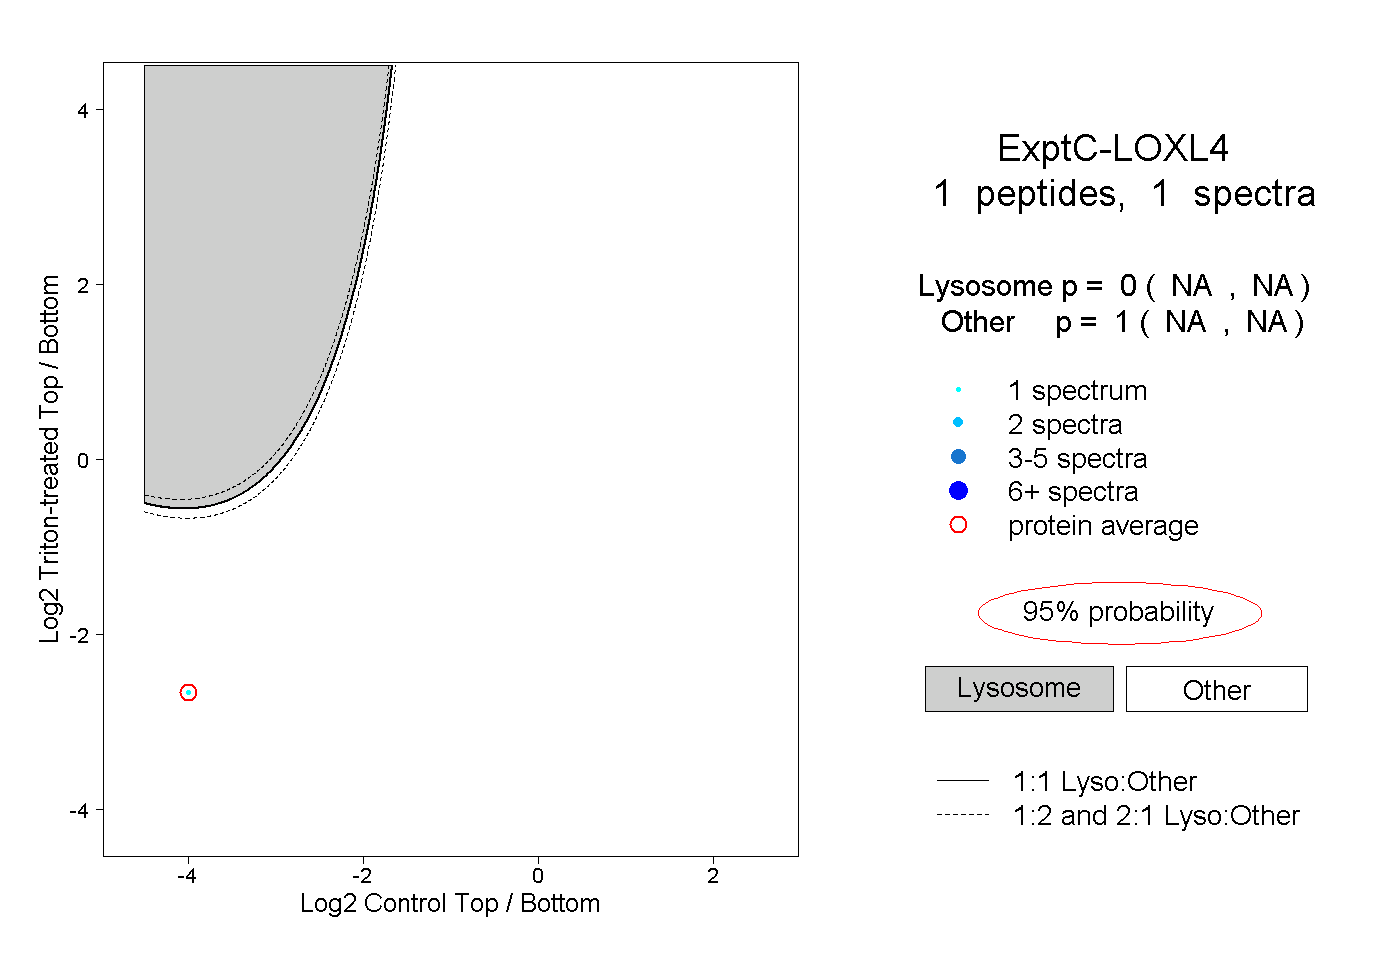 |
0.000 NA | NA |
1.000 NA | NA |
||||||||
| Plot | Lyso | Other | |||||||||||
| Expt D |
1 peptide |
1 spectrum |
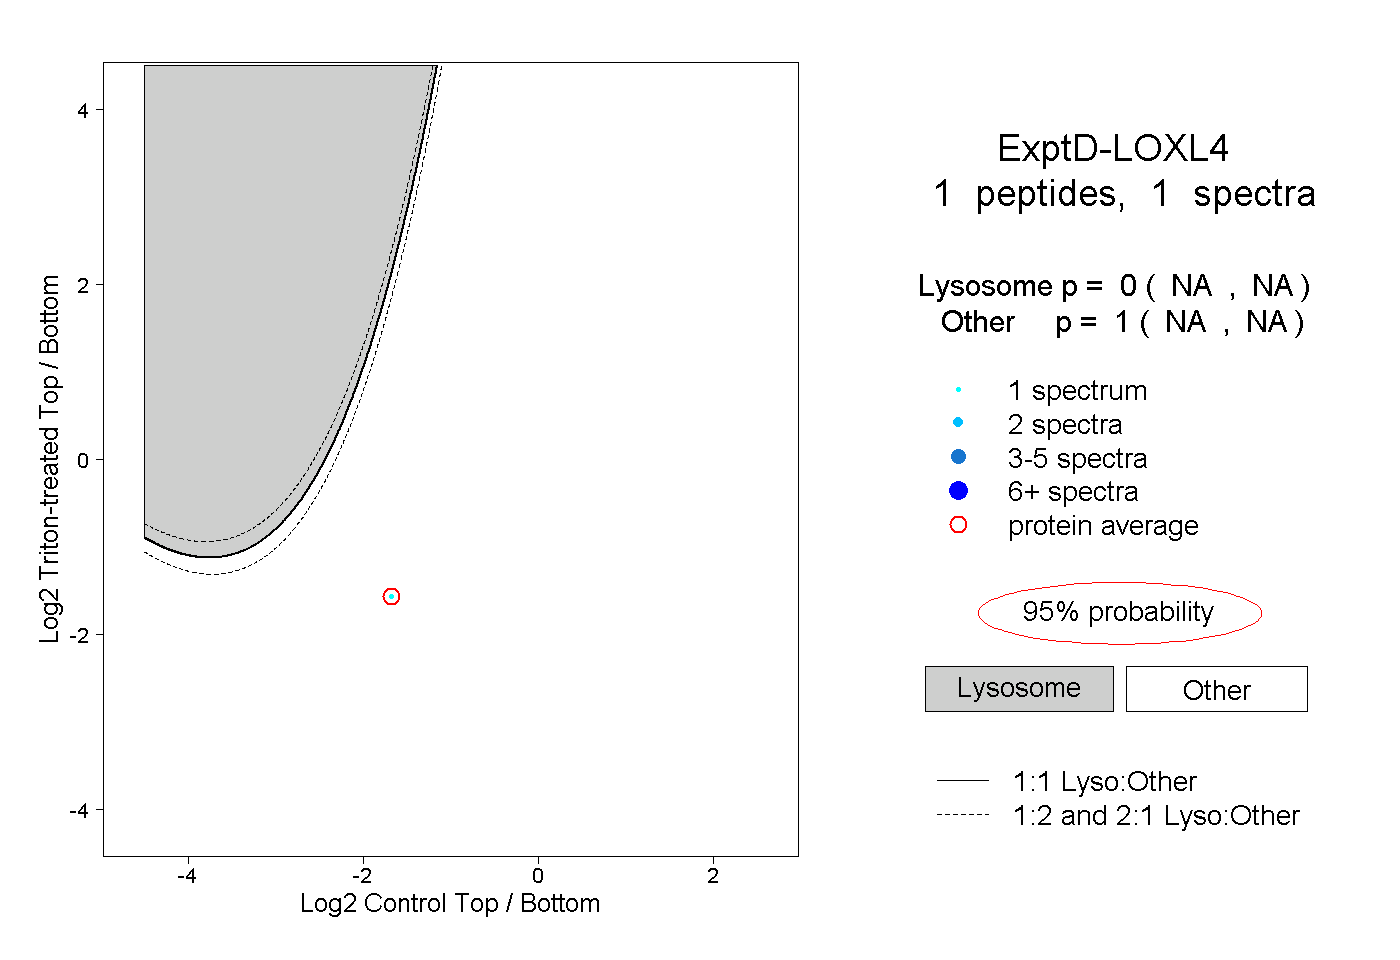 |
0.000 NA | NA |
1.000 NA | NA |