 2
2peptides
spectra
0.000 | 0.000
0.000 | 0.000
0.012 | 0.075
0.000 | 0.085
0.000 | 0.000
0.619 | 0.697
0.218 | 0.272
0.000 | 0.000
3peptides
spectra
0.000 | 0.000
1.000 | 1.000
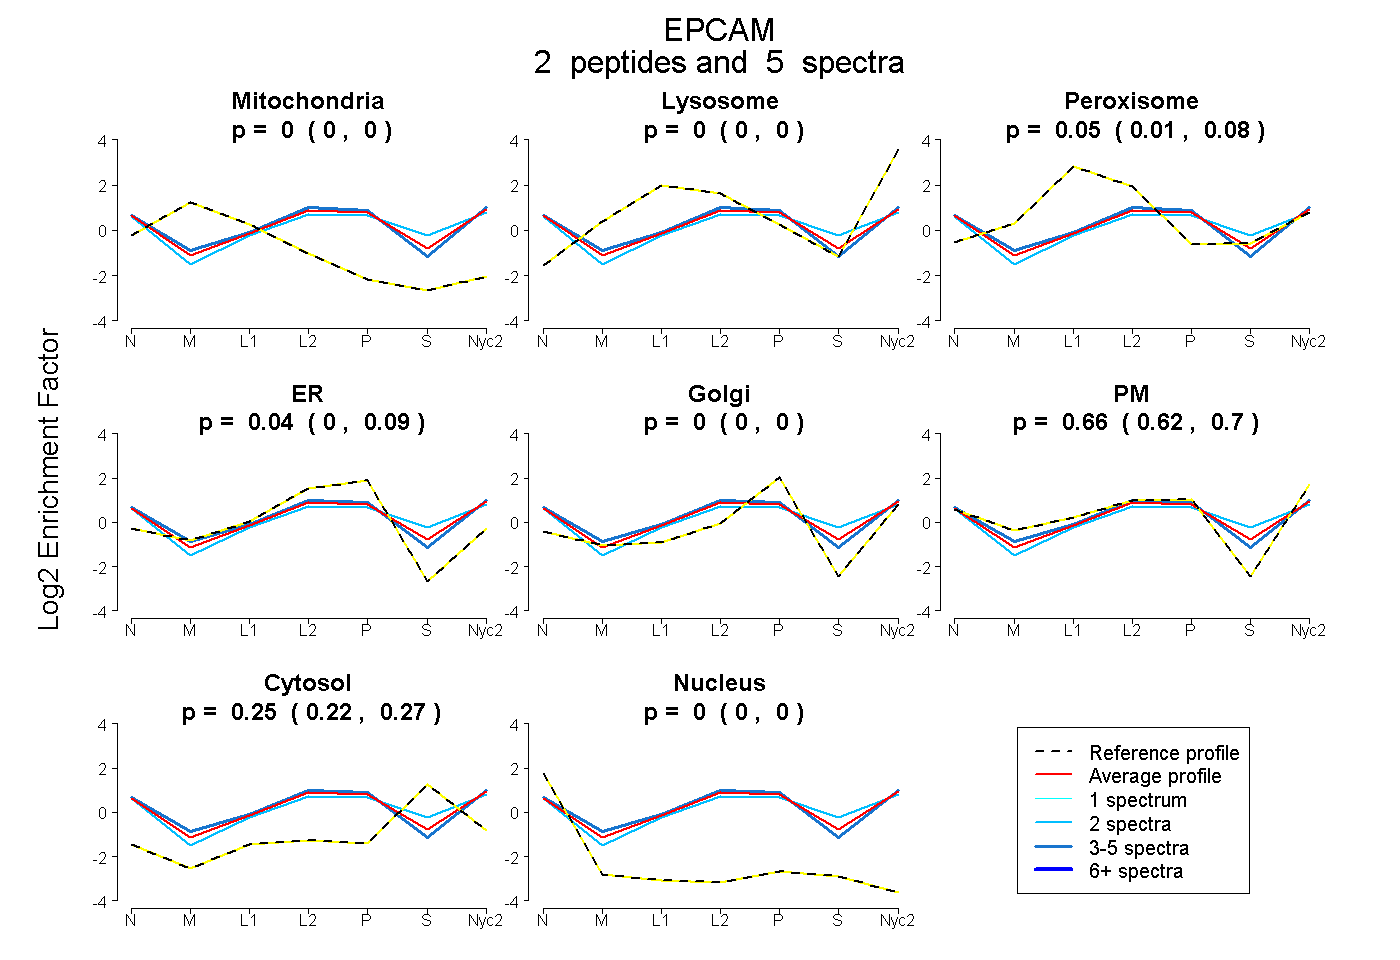
| Plot | Mito | Lyso | Perox | ER | Golgi | PM | Cytosol | Nucleus | |||||
| Expt A |
2 peptides |
5 spectra |
|
0.000 0.000 | 0.000 |
0.000 0.000 | 0.000 |
0.047 0.012 | 0.075 |
0.043 0.000 | 0.085 |
0.000 0.000 | 0.000 |
0.662 0.619 | 0.697 |
0.247 0.218 | 0.272 |
0.000 0.000 | 0.000 |
||
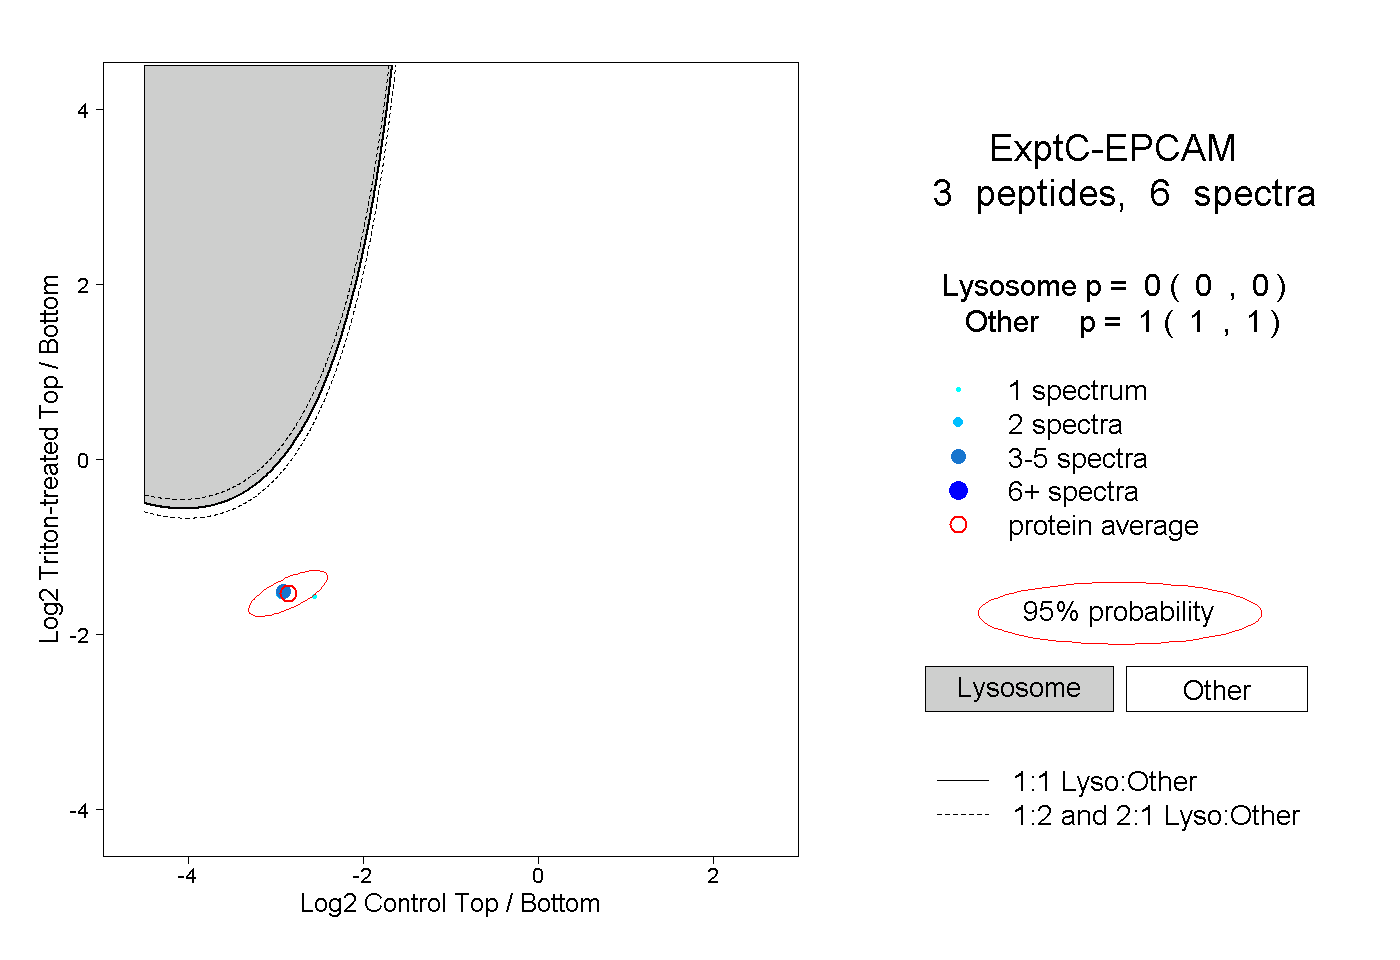
| Plot | Lyso | Other | |||||||||||
| Expt C |
3 peptides |
6 spectra |
|
0.000 0.000 | 0.000 |
1.000 1.000 | 1.000 |