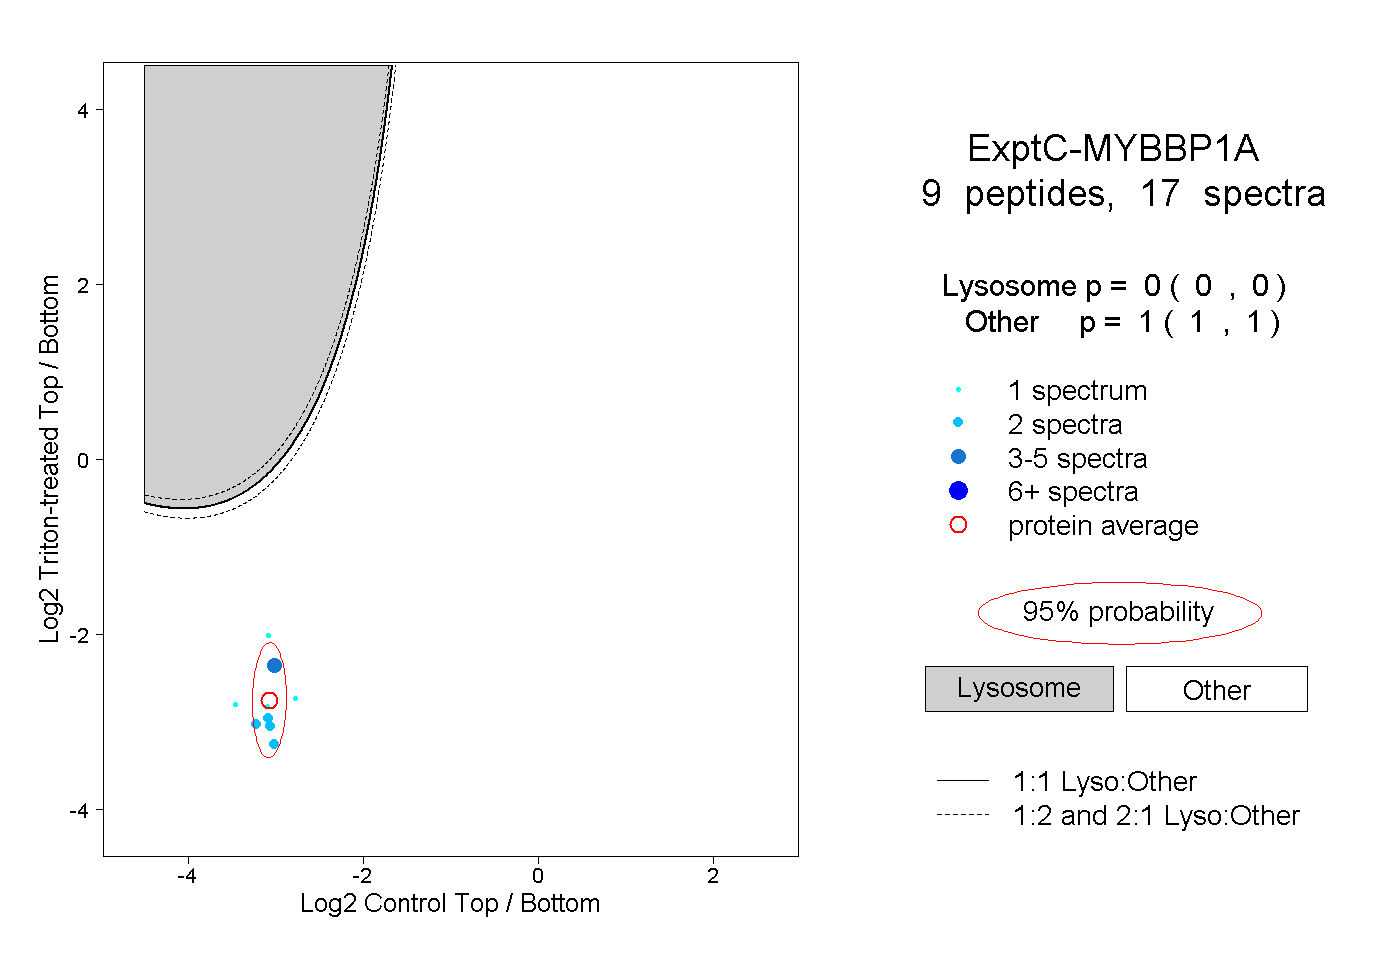
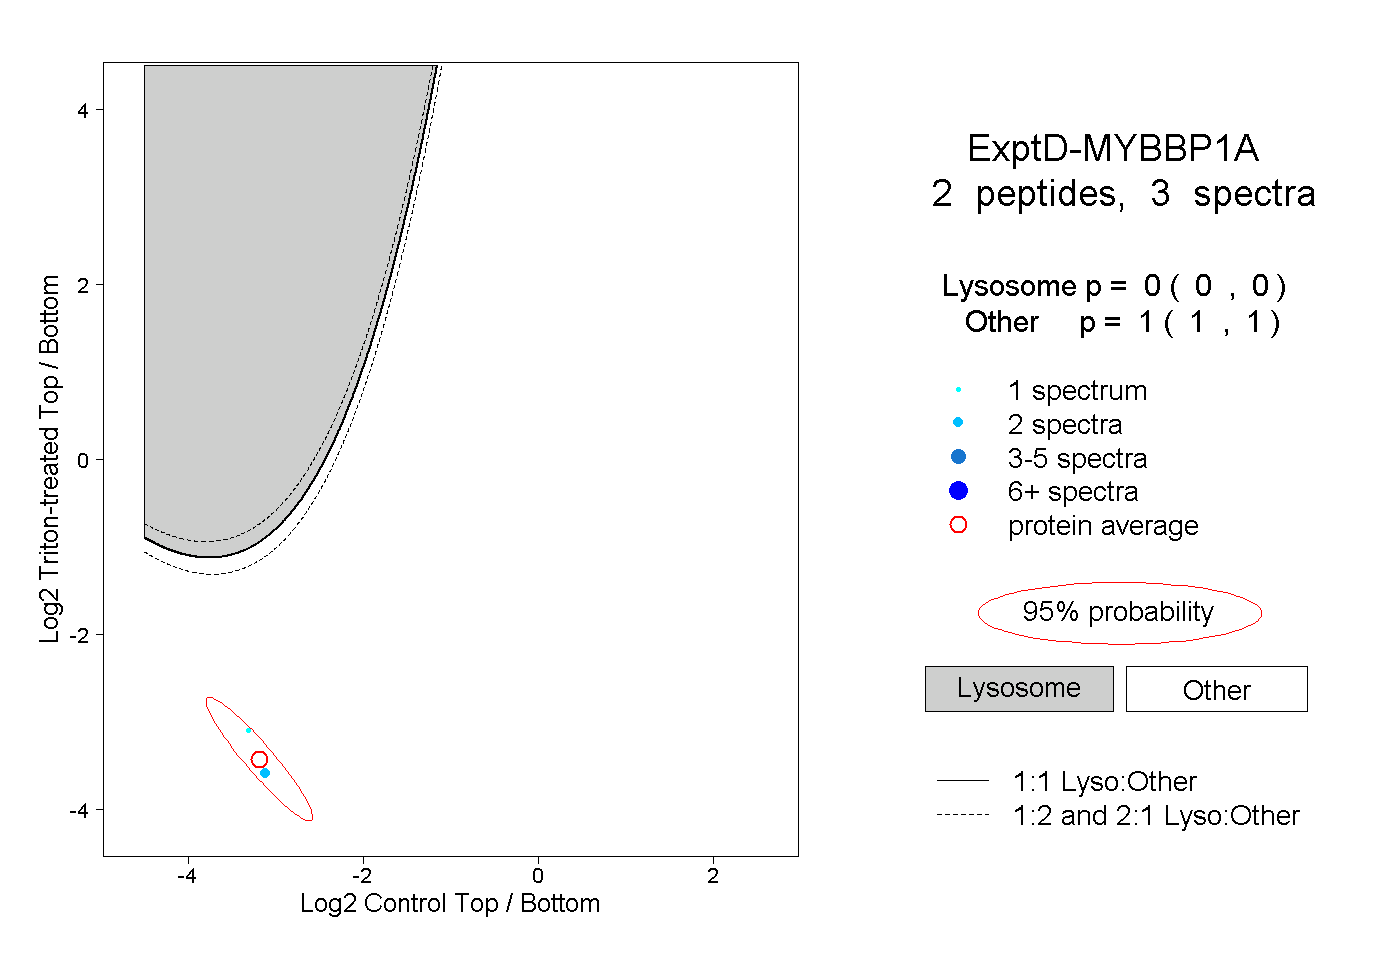
MYBBP1A
[ENSRNOP00000021134]
Main page
| | | Plot |
Mito |
Lyso |
|
Perox |
ER |
Golgi |
PM |
Cytosol |
Nucleus |
|
| Expt A |
 31
31
peptides |
80
spectra |
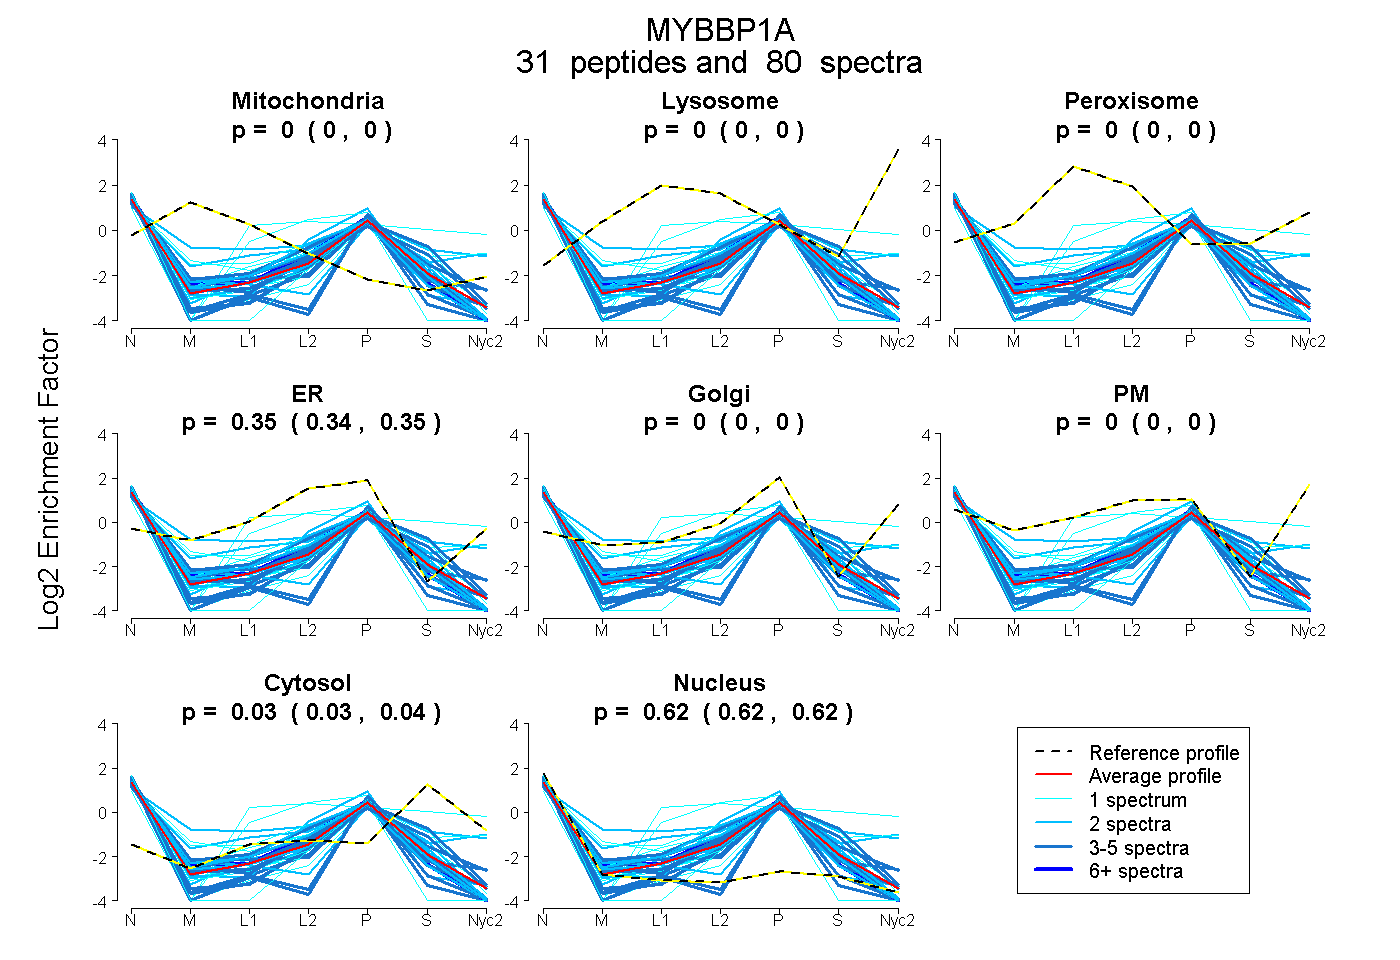 |
0.000
0.000 | 0.000 |
0.000
0.000 | 0.000 |
|
0.000
0.000 | 0.000 |
0.346
0.342 | 0.350 |
0.000
0.000 | 0.000 |
0.000
0.000 | 0.000 |
0.033
0.028 | 0.038 |
0.621
0.616 | 0.624 |
|
| | | Plot |
Mito |
|
Lyso or Perox |
|
ER |
Golgi |
PM |
Cytosol |
Nucleus |
|
| Expt B |
10
peptides |
14
spectra |
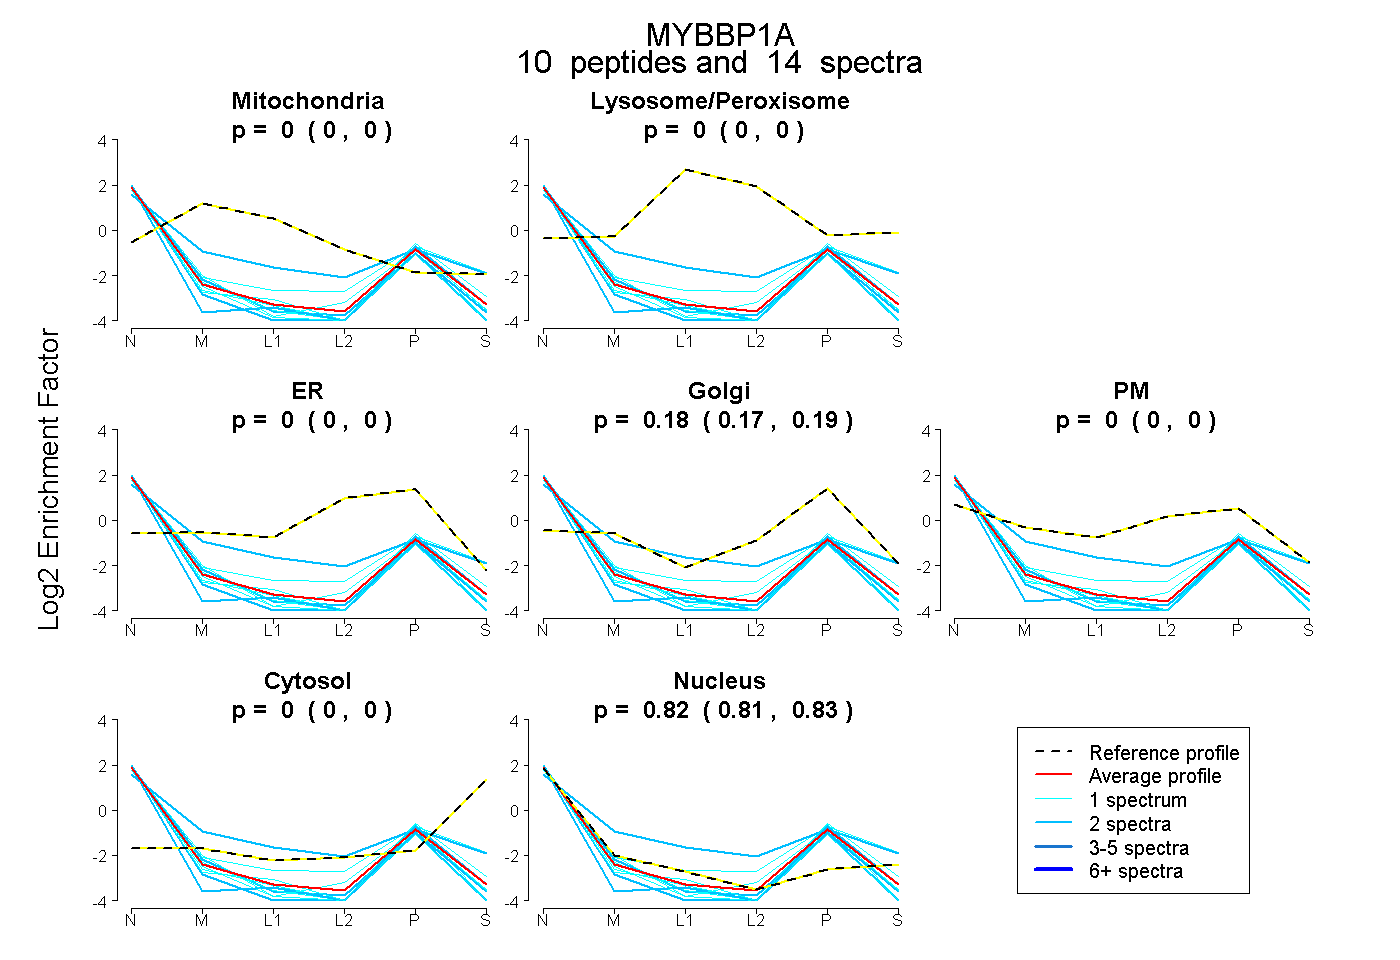 |
0.000
0.000 | 0.000 |
|
0.000
0.000 | 0.000 |
|
0.000
0.000 | 0.000 |
0.179
0.167 | 0.188 |
0.000
0.000 | 0.000 |
0.000
0.000 | 0.000 |
0.821
0.809 | 0.832 |
|
| 1 spectrum, SPSLLQSGIR |
0.000 |
|
0.000 |
|
0.000 |
0.169 |
0.000 |
0.000 |
0.831 |
|
| 1 spectrum, LLEYLR |
0.000 |
|
0.000 |
|
0.000 |
0.079 |
0.000 |
0.000 |
0.921 |
|
| 2 spectra, ALDLIEVLVTK |
0.000 |
|
0.000 |
|
0.000 |
0.063 |
0.000 |
0.000 |
0.937 |
|
| 1 spectrum, LVQLADMLLK |
0.000 |
|
0.000 |
|
0.000 |
0.215 |
0.000 |
0.000 |
0.785 |
|
| 1 spectrum, ELEAQSSETR |
0.000 |
|
0.000 |
|
0.000 |
0.322 |
0.000 |
0.000 |
0.678 |
|
| 1 spectrum, LPDVALNLLR |
0.000 |
|
0.000 |
|
0.000 |
0.130 |
0.000 |
0.000 |
0.870 |
|
| 2 spectra, LSLVSR |
0.000 |
|
0.000 |
|
0.000 |
0.095 |
0.000 |
0.000 |
0.905 |
|
| 1 spectrum, EVLEEGLLK |
0.000 |
|
0.000 |
|
0.000 |
0.139 |
0.000 |
0.000 |
0.861 |
|
| 2 spectra, LITGLGVGR |
0.000 |
|
0.000 |
|
0.000 |
0.136 |
0.000 |
0.000 |
0.864 |
|
| 2 spectra, NVANVTPLTAQQR |
0.000 |
|
0.000 |
|
0.000 |
0.000 |
0.480 |
0.000 |
0.520 |
|
| | | Plot |
|
Lyso |
|
|
|
|
|
|
|
Other |
| Expt C |
9
peptides |
17
spectra |
 |
|
0.000
0.000 | 0.000 |
|
|
|
|
|
|
|
1.000
1.000 | 1.000 |
| | | Plot |
|
Lyso |
|
|
|
|
|
|
|
Other |
| Expt D |
2
peptides |
3
spectra |
 |
|
0.000
0.000 | 0.000 |
|
|
|
|
|
|
|
1.000
1.000 | 1.000 |