 31
31peptides
spectra
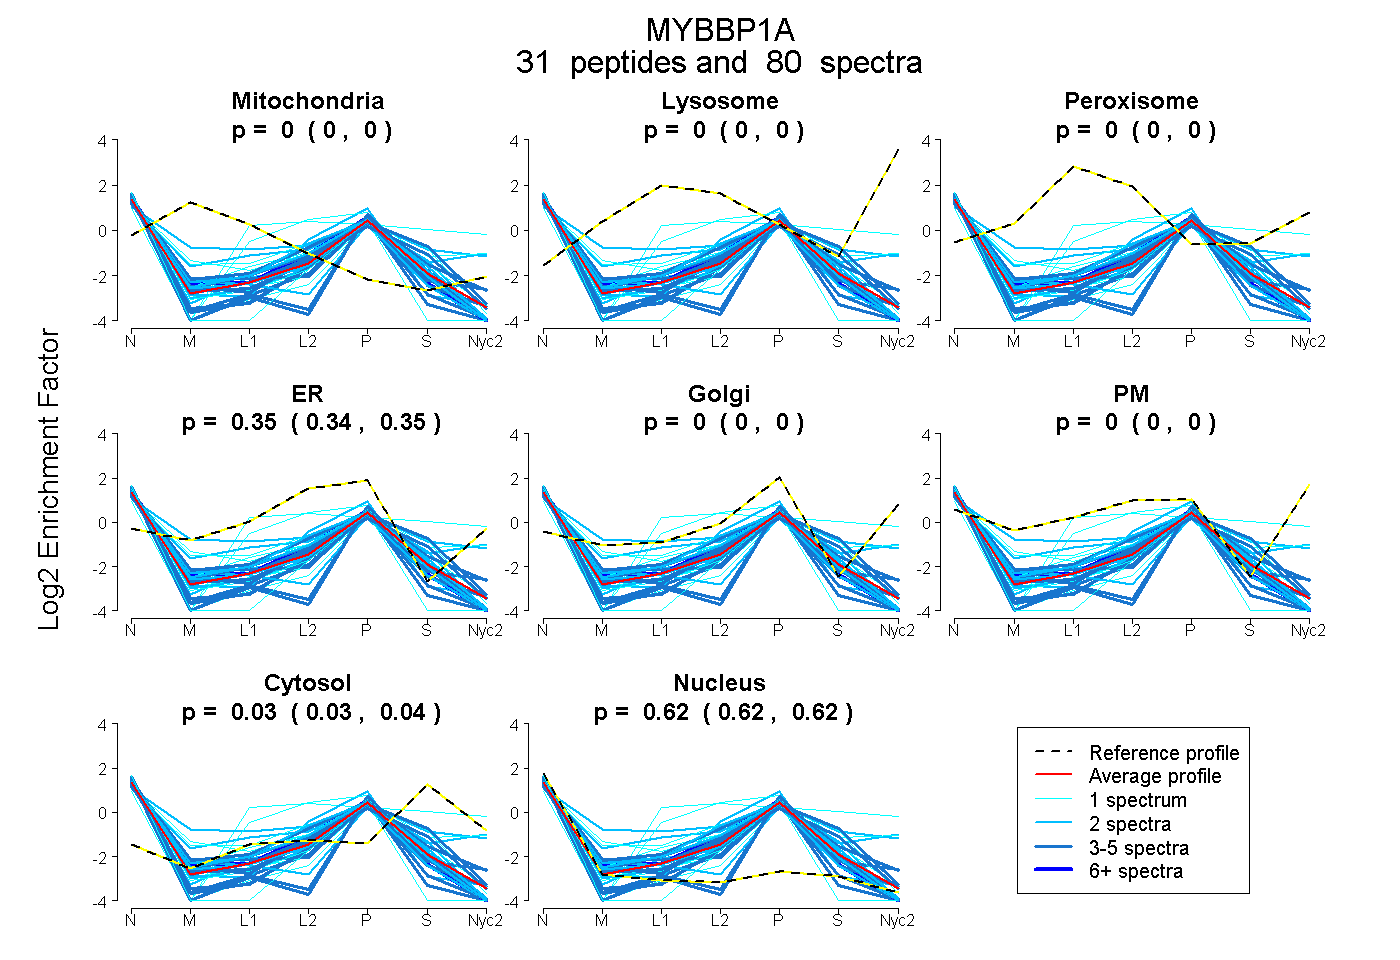
0.000 | 0.000
0.000 | 0.000
0.000 | 0.000
0.342 | 0.350
0.000 | 0.000
0.000 | 0.000
0.028 | 0.038
0.616 | 0.624
| Plot | Mito | Lyso | Perox | ER | Golgi | PM | Cytosol | Nucleus | |||||
| Expt A |
31 peptides |
80 spectra |
|
0.000 0.000 | 0.000 |
0.000 0.000 | 0.000 |
0.000 0.000 | 0.000 |
0.346 0.342 | 0.350 |
0.000 0.000 | 0.000 |
0.000 0.000 | 0.000 |
0.033 0.028 | 0.038 |
0.621 0.616 | 0.624 |
| 4 spectra, SPSLLQSGIR | 0.000 | 0.000 | 0.000 | 0.000 | 0.182 | 0.000 | 0.000 | 0.818 | ||
| 4 spectra, ALDLIEVLVTK | 0.000 | 0.000 | 0.000 | 0.240 | 0.000 | 0.000 | 0.000 | 0.760 | ||
| 4 spectra, YNLQAMNK | 0.000 | 0.000 | 0.000 | 0.292 | 0.000 | 0.000 | 0.245 | 0.464 | ||
| 1 spectrum, HYCHEVEPGAEALHAQVER | 0.000 | 0.000 | 0.000 | 0.518 | 0.000 | 0.000 | 0.022 | 0.459 | ||
| 4 spectra, VQVASLNVPER | 0.000 | 0.000 | 0.000 | 0.327 | 0.000 | 0.000 | 0.000 | 0.673 | ||
| 2 spectra, VAANSVK | 0.000 | 0.000 | 0.000 | 0.419 | 0.000 | 0.000 | 0.000 | 0.581 | ||
| 1 spectrum, LEGADIK | 0.000 | 0.000 | 0.000 | 0.070 | 0.368 | 0.046 | 0.203 | 0.314 | ||
| 5 spectra, LSLVSR | 0.000 | 0.000 | 0.000 | 0.000 | 0.201 | 0.000 | 0.034 | 0.765 | ||
| 6 spectra, IFMHHLCR | 0.000 | 0.000 | 0.000 | 0.377 | 0.000 | 0.000 | 0.000 | 0.623 | ||
| 3 spectra, YLELFLLAR | 0.000 | 0.000 | 0.000 | 0.263 | 0.000 | 0.000 | 0.177 | 0.559 | ||
| 1 spectrum, DSEVQTTSCLDLDFVTR | 0.000 | 0.000 | 0.000 | 0.254 | 0.000 | 0.000 | 0.033 | 0.714 | ||
| 2 spectra, DEAVVEQIAR | 0.000 | 0.000 | 0.000 | 0.244 | 0.000 | 0.000 | 0.128 | 0.628 | ||
| 2 spectra, YPVICK | 0.000 | 0.000 | 0.000 | 0.387 | 0.000 | 0.000 | 0.000 | 0.613 | ||
| 1 spectrum, VYSASLESLLTK | 0.000 | 0.000 | 0.000 | 0.195 | 0.000 | 0.000 | 0.000 | 0.805 | ||
| 2 spectra, YQDGQK | 0.000 | 0.000 | 0.000 | 0.308 | 0.000 | 0.000 | 0.056 | 0.635 | ||
| 2 spectra, HFGEHMVVSK | 0.045 | 0.000 | 0.074 | 0.149 | 0.156 | 0.210 | 0.092 | 0.274 | ||
| 4 spectra, LPDVALNLLR | 0.000 | 0.000 | 0.000 | 0.251 | 0.000 | 0.000 | 0.000 | 0.749 | ||
| 1 spectrum, DIPSDSQSPISTK | 0.000 | 0.000 | 0.000 | 0.086 | 0.101 | 0.000 | 0.027 | 0.785 | ||
| 2 spectra, EVLEEGLLK | 0.000 | 0.000 | 0.000 | 0.440 | 0.000 | 0.000 | 0.000 | 0.560 | ||
| 2 spectra, SPAPNNPTLSPSTPPAK | 0.000 | 0.000 | 0.000 | 0.150 | 0.109 | 0.000 | 0.000 | 0.740 | ||
| 3 spectra, LITGLGVGR | 0.000 | 0.000 | 0.000 | 0.346 | 0.000 | 0.000 | 0.000 | 0.654 | ||
| 2 spectra, GFLPETK | 0.000 | 0.000 | 0.000 | 0.211 | 0.071 | 0.186 | 0.262 | 0.269 | ||
| 1 spectrum, VILSSPK | 0.000 | 0.000 | 0.000 | 0.291 | 0.000 | 0.000 | 0.000 | 0.709 | ||
| 3 spectra, LLEYLR | 0.000 | 0.000 | 0.000 | 0.347 | 0.000 | 0.000 | 0.000 | 0.653 | ||
| 1 spectrum, ATPQIPETK | 0.000 | 0.000 | 0.027 | 0.214 | 0.000 | 0.210 | 0.517 | 0.032 | ||
| 2 spectra, ELEAQSSETR | 0.000 | 0.000 | 0.000 | 0.283 | 0.000 | 0.000 | 0.000 | 0.717 | ||
| 5 spectra, LVQLADMLLK | 0.000 | 0.000 | 0.000 | 0.000 | 0.353 | 0.000 | 0.000 | 0.647 | ||
| 3 spectra, KPSYTSSYMCFR | 0.000 | 0.000 | 0.000 | 0.323 | 0.000 | 0.000 | 0.000 | 0.677 | ||
| 1 spectrum, SQNPLR | 0.000 | 0.000 | 0.000 | 0.445 | 0.000 | 0.000 | 0.060 | 0.495 | ||
| 1 spectrum, NVANVTPLTAQQR | 0.000 | 0.000 | 0.000 | 0.396 | 0.000 | 0.000 | 0.175 | 0.429 | ||
| 5 spectra, TRPSDSEMK | 0.000 | 0.000 | 0.000 | 0.436 | 0.000 | 0.000 | 0.101 | 0.463 |
| Plot | Mito | Lyso or Perox | ER | Golgi | PM | Cytosol | Nucleus | ||||||
| Expt B |
10 peptides |
14 spectra |
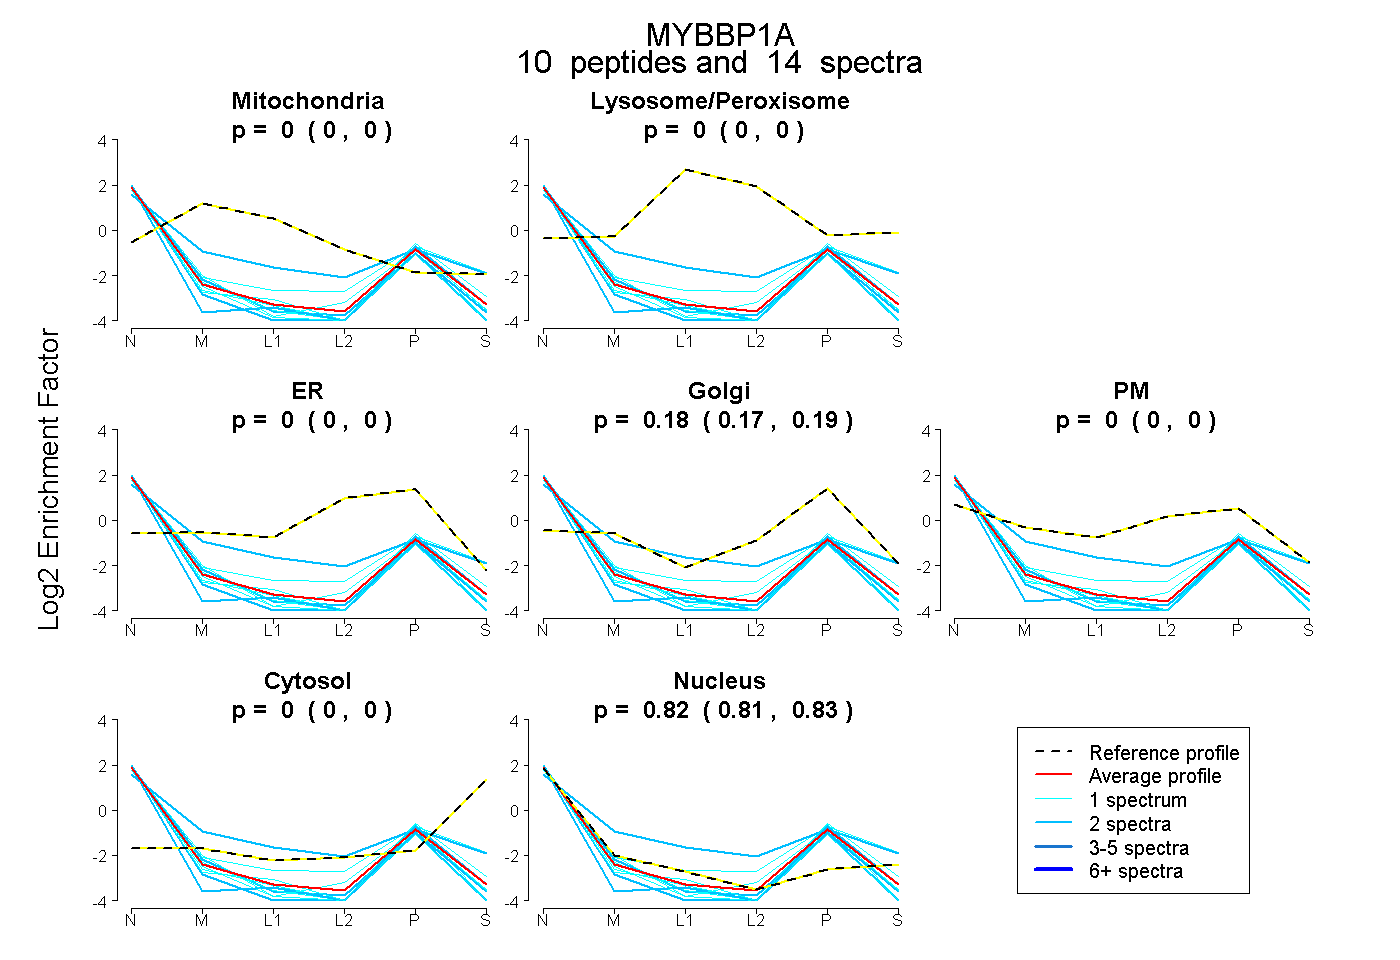 |
0.000 0.000 | 0.000 |
0.000 0.000 | 0.000 |
0.000 0.000 | 0.000 |
0.179 0.167 | 0.188 |
0.000 0.000 | 0.000 |
0.000 0.000 | 0.000 |
0.821 0.809 | 0.832 |
|||
| Plot | Lyso | Other | |||||||||||
| Expt C |
9 peptides |
17 spectra |
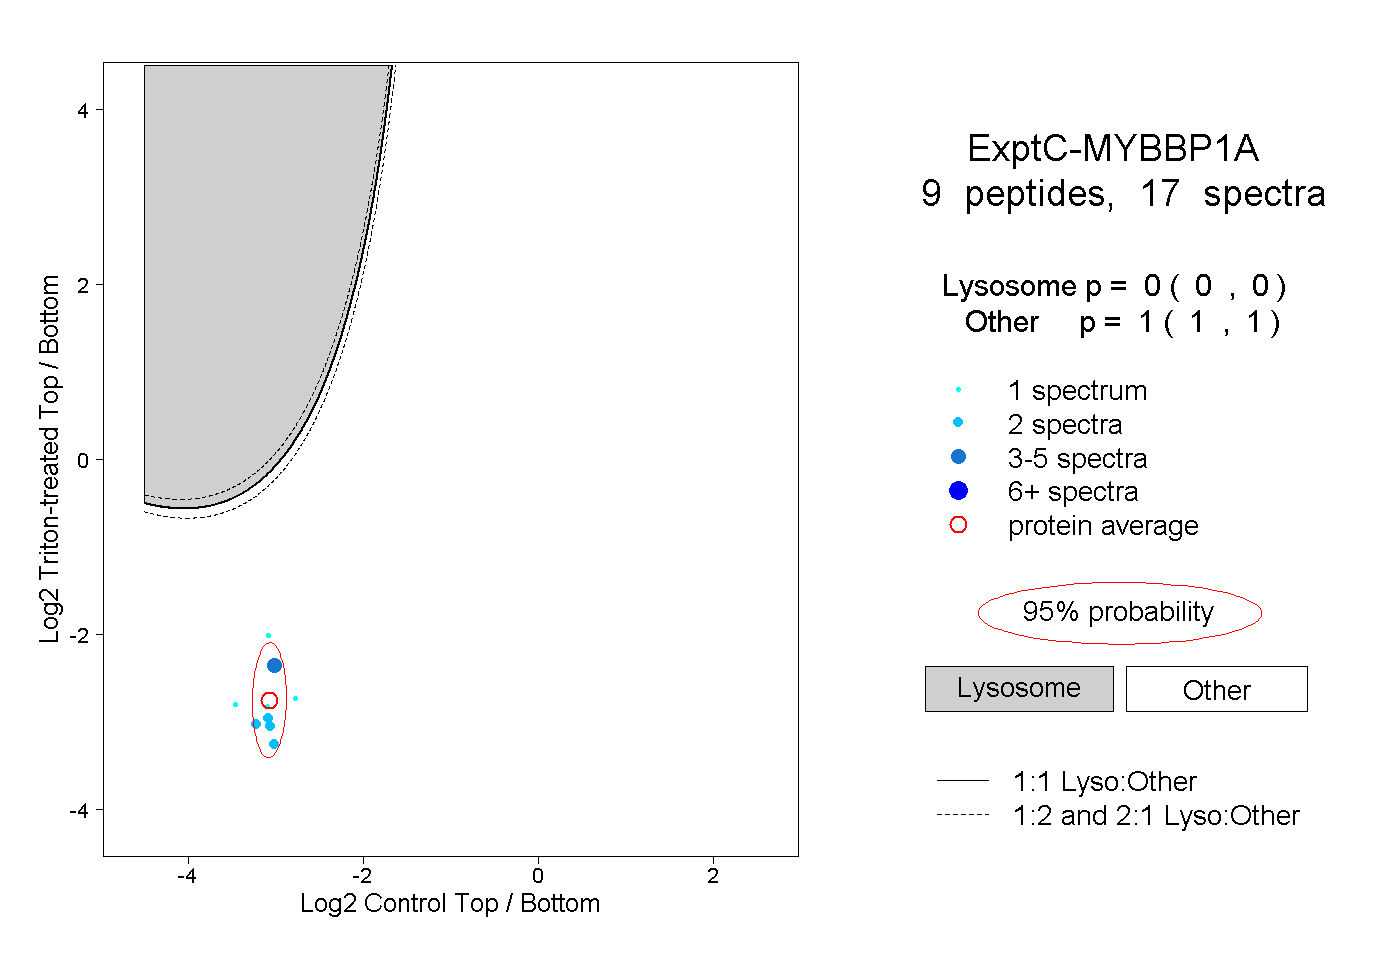 |
0.000 0.000 | 0.000 |
1.000 1.000 | 1.000 |
||||||||
| Plot | Lyso | Other | |||||||||||
| Expt D |
2 peptides |
3 spectra |
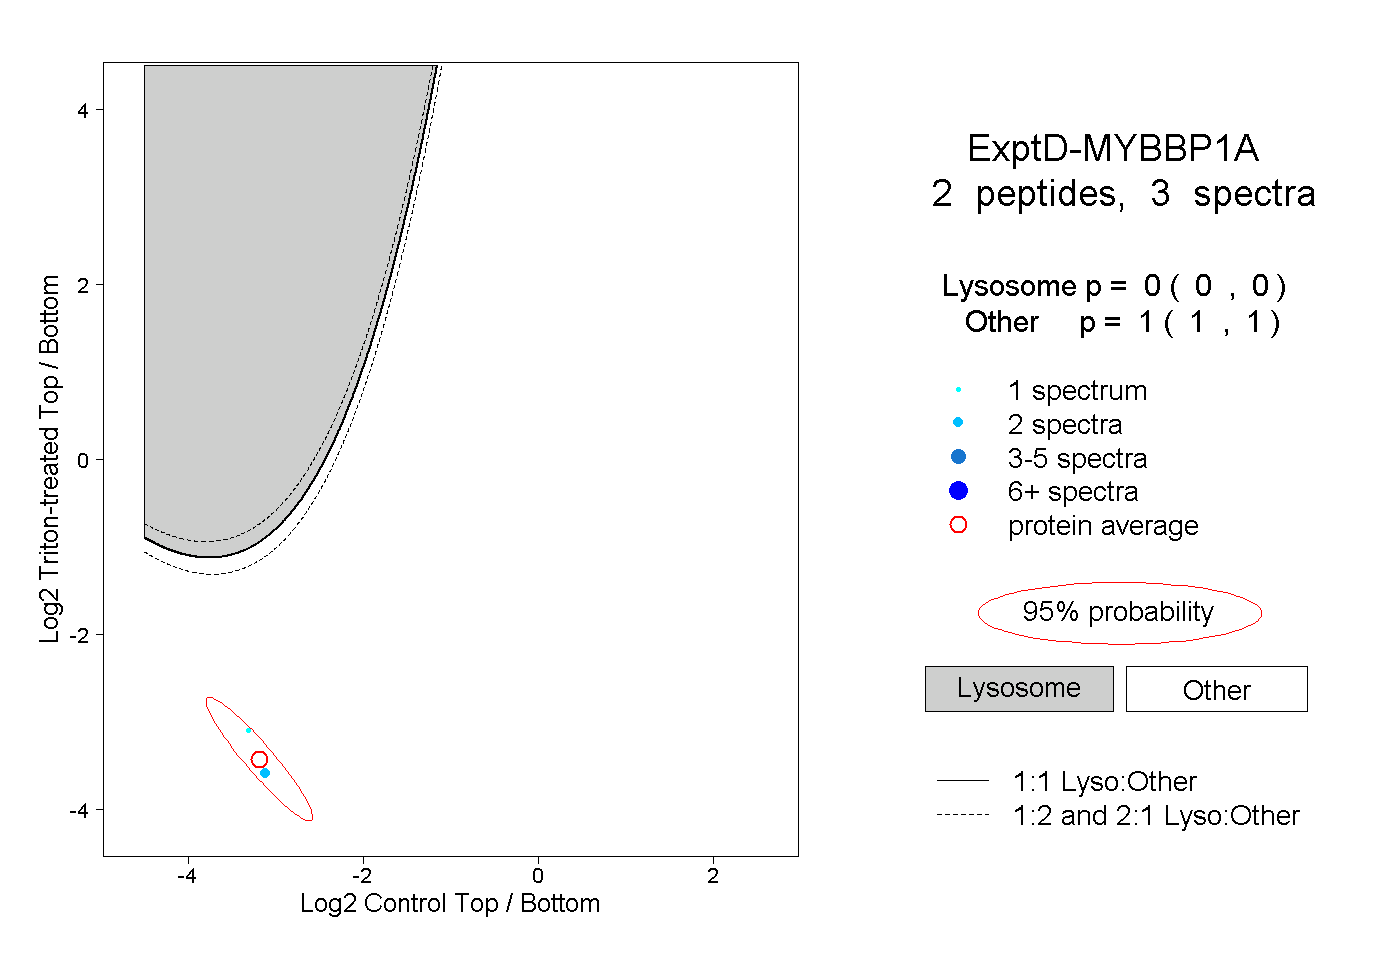 |
0.000 0.000 | 0.000 |
1.000 1.000 | 1.000 |