 2
2peptides
spectra
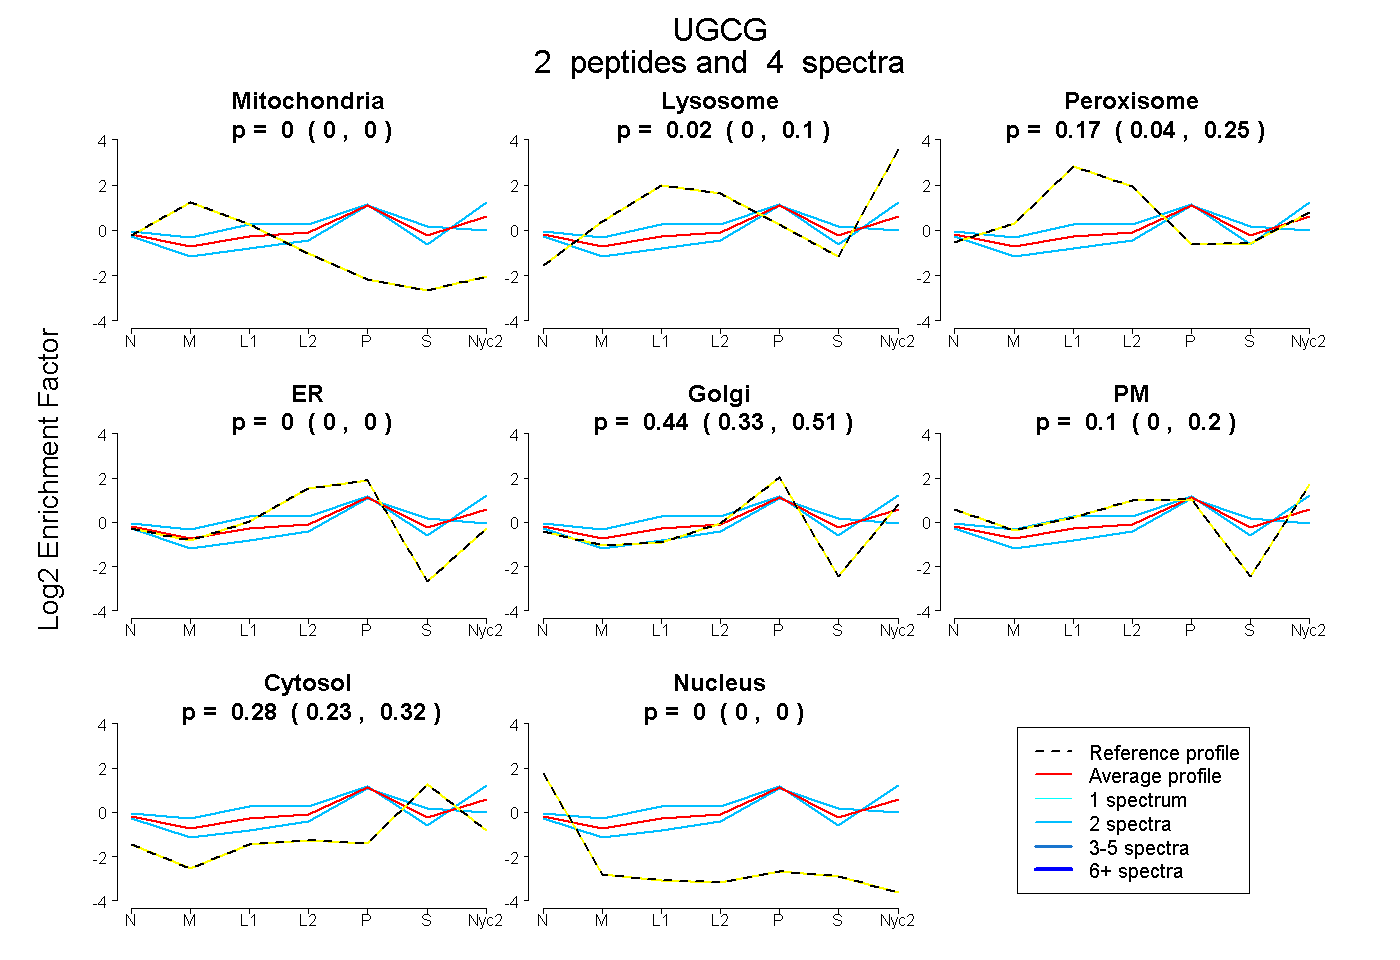
0.000 | 0.000
0.000 | 0.104
0.037 | 0.253
0.000 | 0.000
0.327 | 0.509
0.000 | 0.198
0.229 | 0.318
0.000 | 0.000
2peptides
spectra
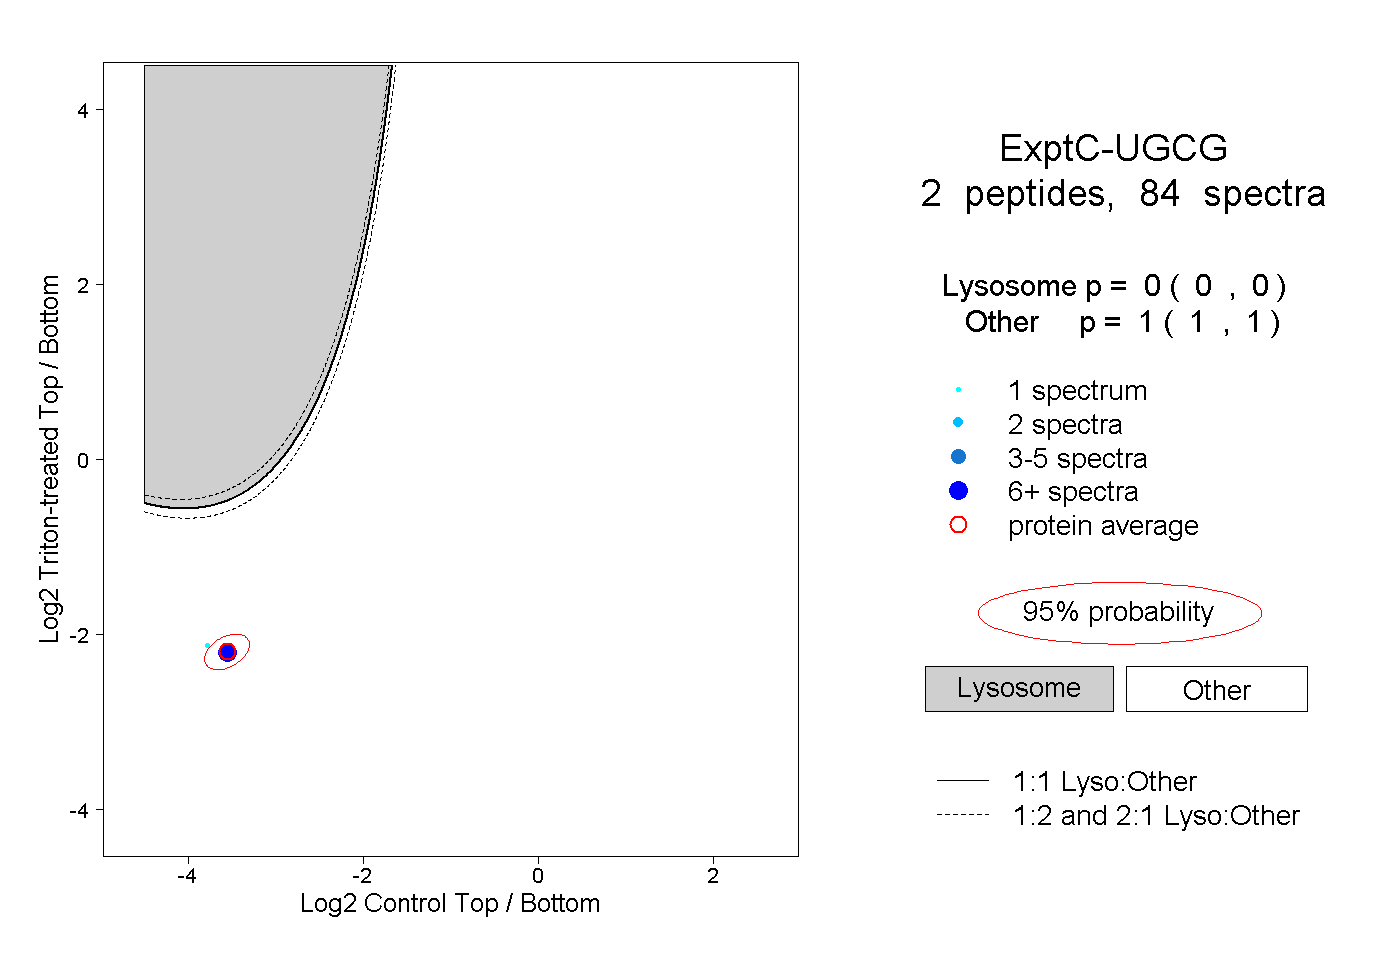
0.000 | 0.000
1.000 | 1.000
1peptide
spectra
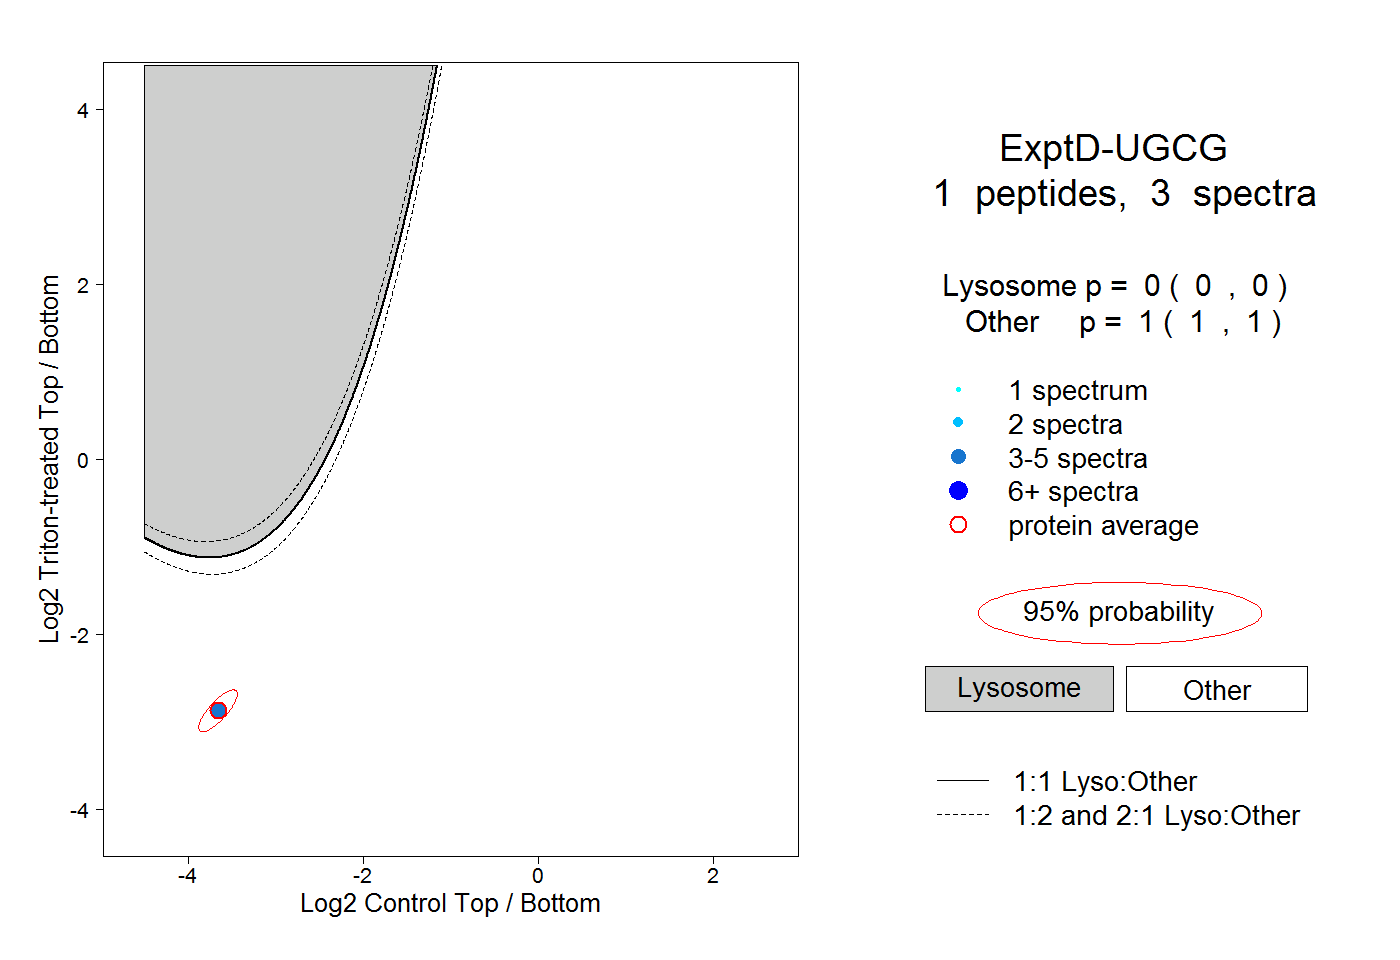
0.000 | 0.000
1.000 | 1.000