 2
2peptides
spectra
0.000 | 0.000
0.000 | 0.000
0.000 | 0.000
0.000 | 0.119
0.000 | 0.113
0.000 | 0.000
0.263 | 0.292
0.588 | 0.627
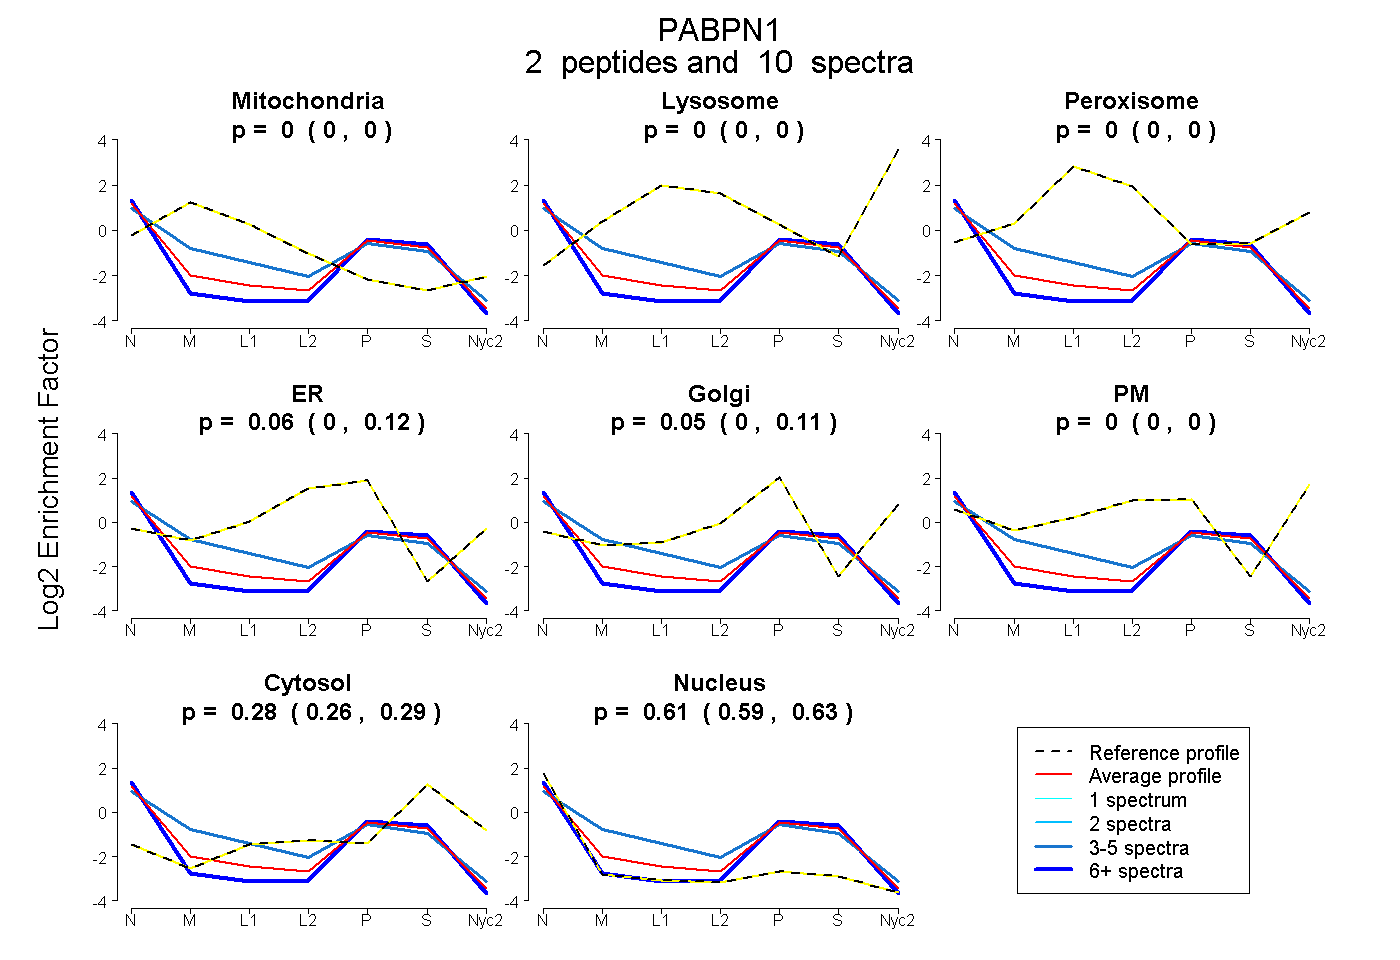
| Plot | Mito | Lyso | Perox | ER | Golgi | PM | Cytosol | Nucleus | |||||
| Expt A |
2 peptides |
10 spectra |
|
0.000 0.000 | 0.000 |
0.000 0.000 | 0.000 |
0.000 0.000 | 0.000 |
0.065 0.000 | 0.119 |
0.047 0.000 | 0.113 |
0.000 0.000 | 0.000 |
0.279 0.263 | 0.292 |
0.609 0.588 | 0.627 |
| 4 spectra, TSLALDESLFR | 0.244 | 0.000 | 0.000 | 0.138 | 0.000 | 0.000 | 0.218 | 0.401 | ||
| 6 spectra, ELQNEVEK | 0.000 | 0.000 | 0.000 | 0.000 | 0.024 | 0.000 | 0.294 | 0.682 |