 10
10peptides
spectra
0.000 | 0.000
0.000 | 0.002
0.000 | 0.000
0.000 | 0.000
0.000 | 0.002
0.050 | 0.073
0.925 | 0.943
0.000 | 0.000
| Plot | Mito | Lyso | Perox | ER | Golgi | PM | Cytosol | Nucleus | |||||
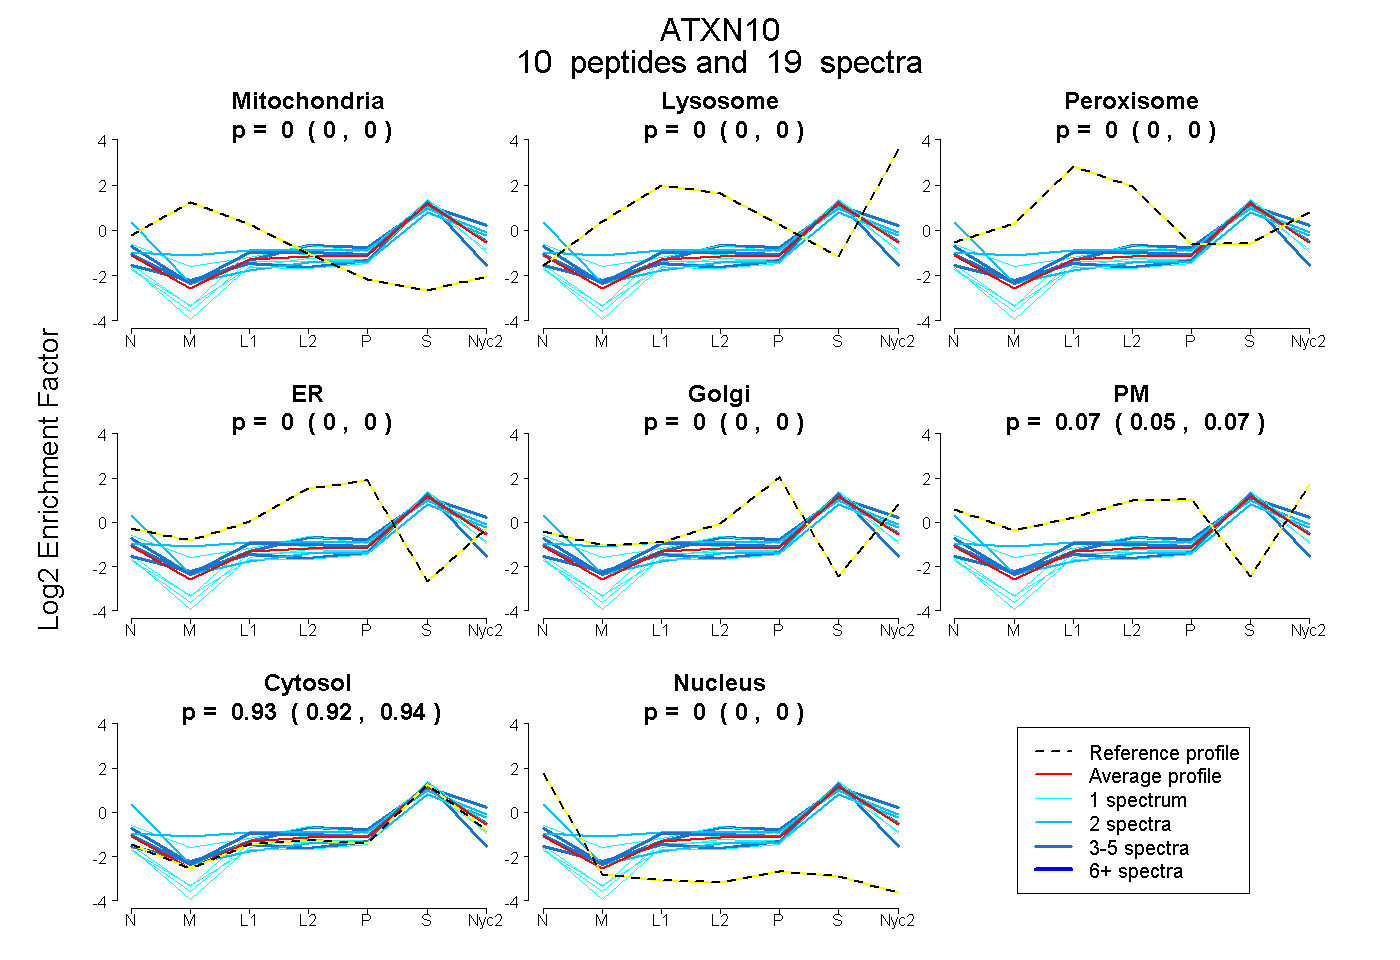
| Expt A |
10 peptides |
19 spectra |
|
0.000 0.000 | 0.000 |
0.000 0.000 | 0.002 |
0.000 0.000 | 0.000 |
0.000 0.000 | 0.000 |
0.000 0.000 | 0.002 |
0.065 0.050 | 0.073 |
0.935 0.925 | 0.943 |
0.000 0.000 | 0.000 |
| 4 spectra, LIGNLCYK | 0.029 | 0.000 | 0.000 | 0.000 | 0.000 | 0.000 | 0.940 | 0.031 | ||
| 1 spectrum, LTSEPQTEDK | 0.039 | 0.000 | 0.075 | 0.037 | 0.000 | 0.053 | 0.782 | 0.015 | ||
| 1 spectrum, DSTNIFSPSDSLK | 0.000 | 0.000 | 0.000 | 0.000 | 0.000 | 0.000 | 1.000 | 0.000 | ||
| 1 spectrum, VTLLDIMIAK | 0.000 | 0.000 | 0.000 | 0.000 | 0.000 | 0.000 | 1.000 | 0.000 | ||
| 2 spectra, LSNQER | 0.000 | 0.000 | 0.000 | 0.000 | 0.000 | 0.133 | 0.728 | 0.139 | ||
| 3 spectra, SPELVEAMYGK | 0.000 | 0.000 | 0.070 | 0.000 | 0.000 | 0.048 | 0.883 | 0.000 | ||
| 2 spectra, MGFEVEK | 0.077 | 0.153 | 0.000 | 0.000 | 0.000 | 0.037 | 0.732 | 0.000 | ||
| 1 spectrum, IVGDEQLTK | 0.000 | 0.017 | 0.000 | 0.017 | 0.000 | 0.000 | 0.966 | 0.000 | ||
| 3 spectra, ALTALFK | 0.000 | 0.043 | 0.000 | 0.000 | 0.000 | 0.148 | 0.808 | 0.000 | ||
| 1 spectrum, DDISIFLR | 0.000 | 0.000 | 0.000 | 0.000 | 0.000 | 0.000 | 1.000 | 0.000 |
| Plot | Mito | Lyso or Perox | ER | Golgi | PM | Cytosol | Nucleus | ||||||
| Expt B |
4 peptides |
5 spectra |
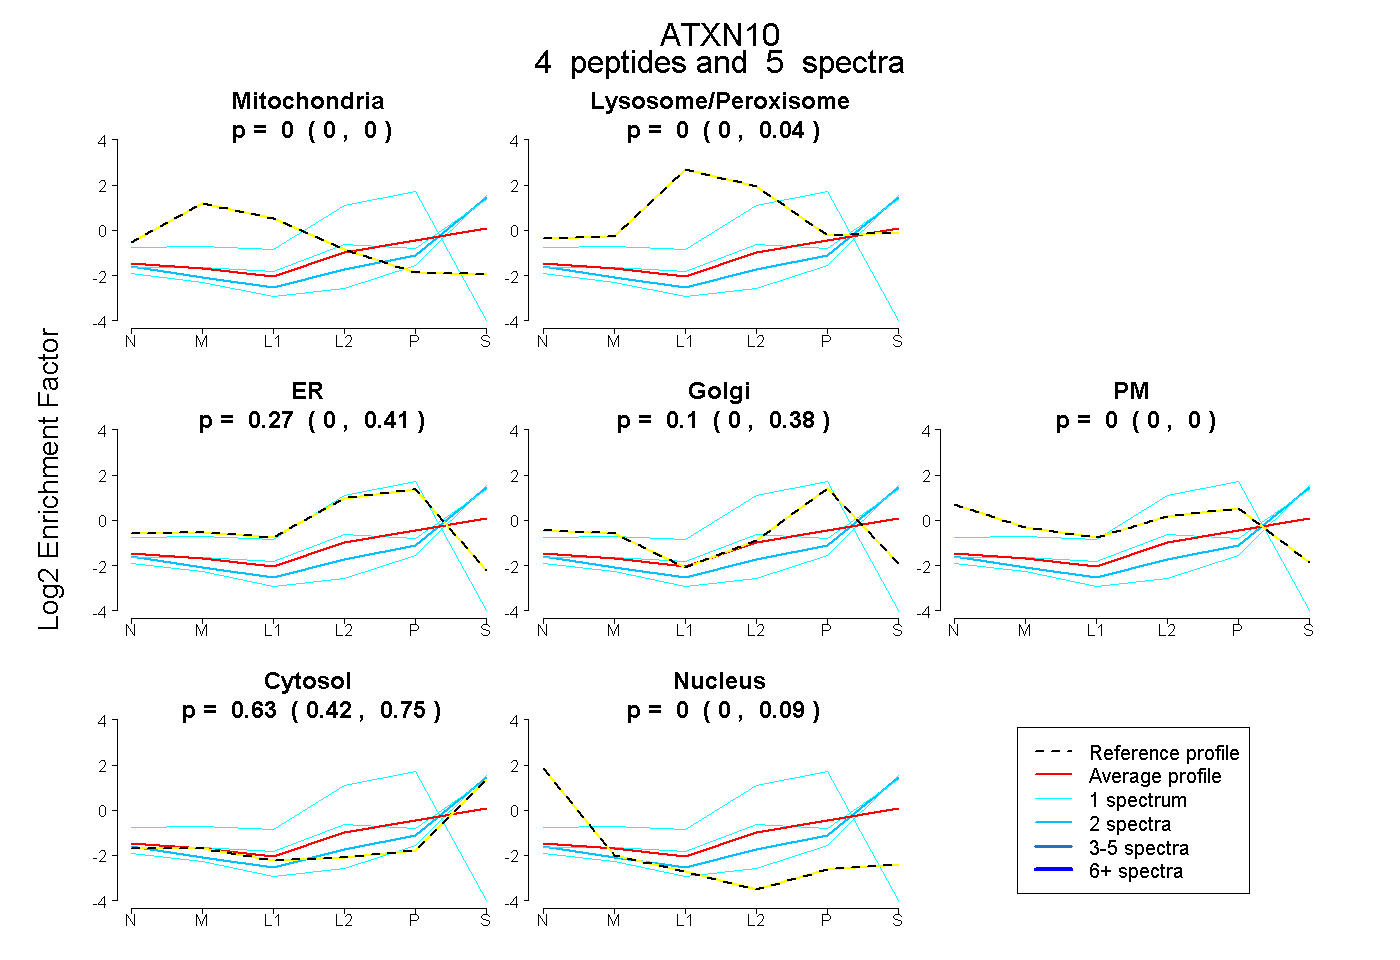 |
0.000 0.000 | 0.000 |
0.000 0.000 | 0.037 |
0.268 0.000 | 0.410 |
0.103 0.000 | 0.379 |
0.000 0.000 | 0.000 |
0.630 0.417 | 0.751 |
0.000 0.000 | 0.085 |
|||
| Plot | Lyso | Other | |||||||||||
| Expt C |
4 peptides |
7 spectra |
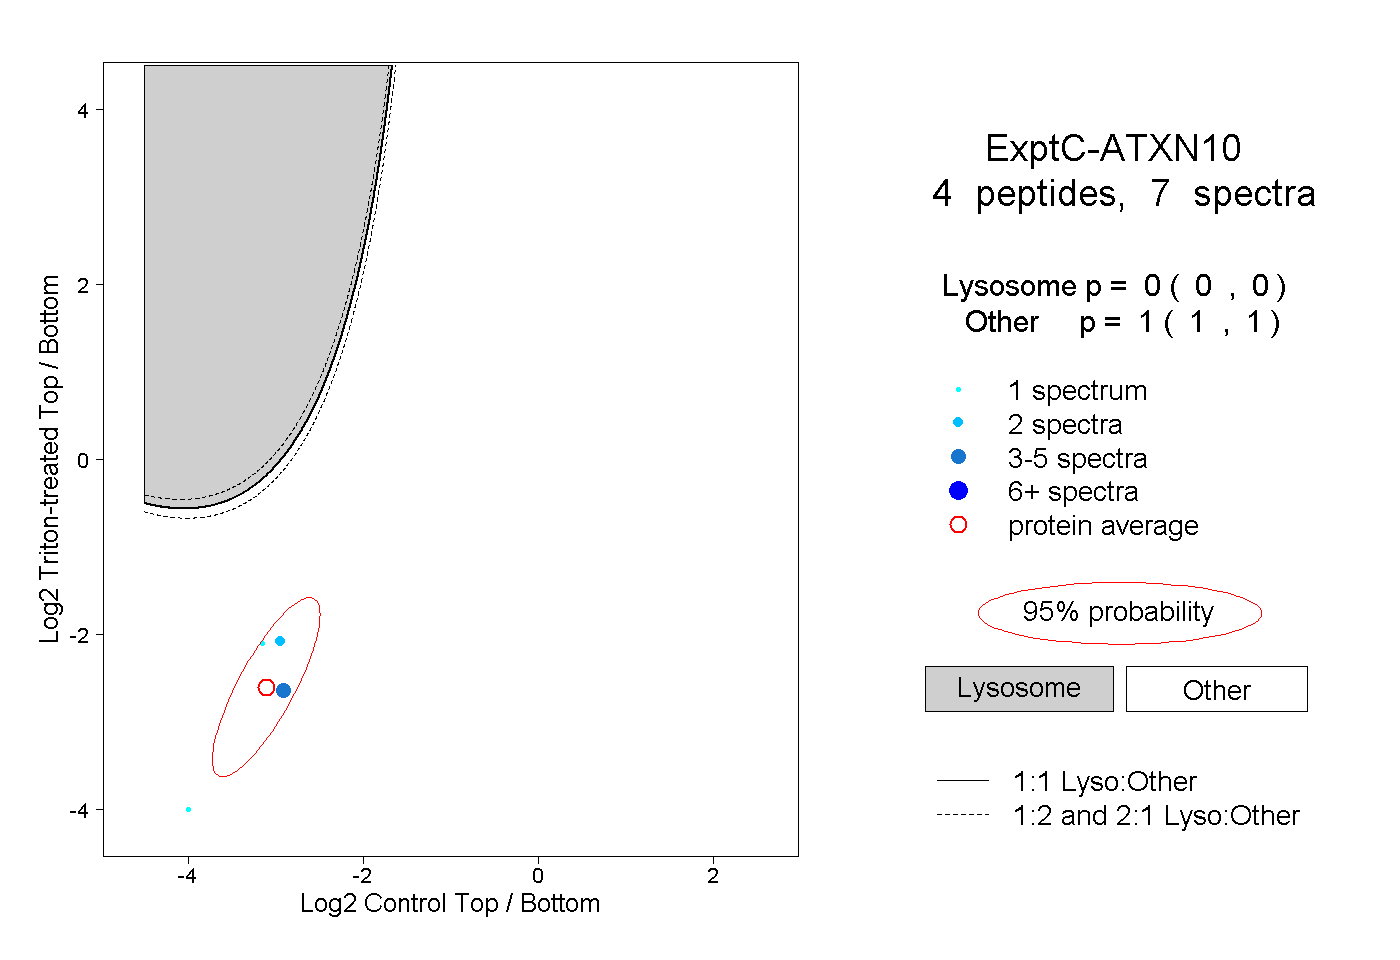 |
0.000 0.000 | 0.000 |
1.000 1.000 | 1.000 |