5
5peptides
spectra
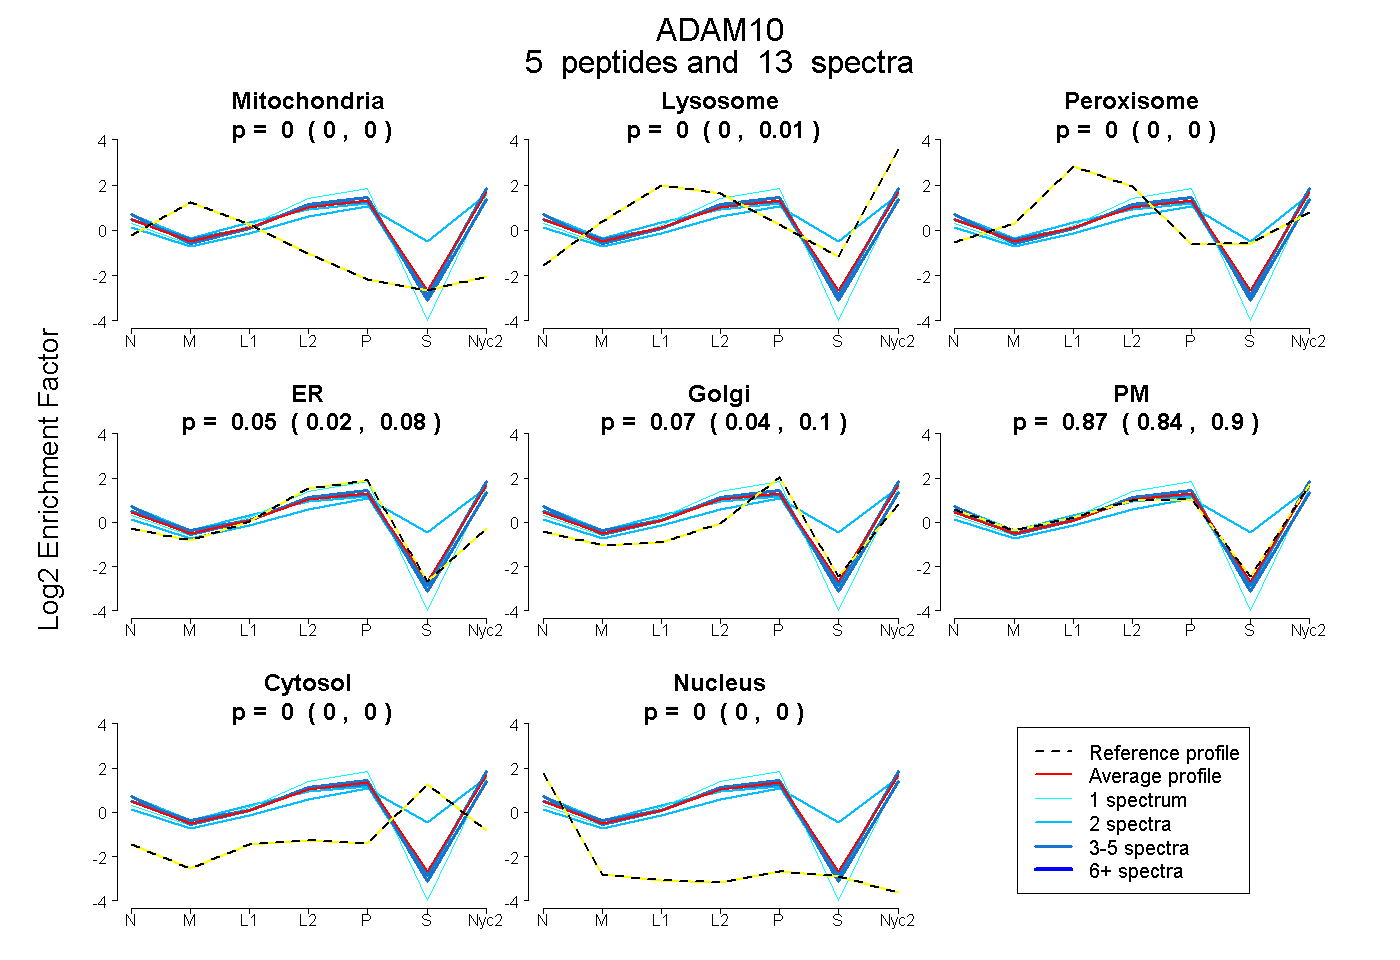
0.000 | 0.000
0.000 | 0.013
0.000 | 0.000
0.019 | 0.081
0.041 | 0.103
0.835 | 0.896
0.000 | 0.000
0.000 | 0.000
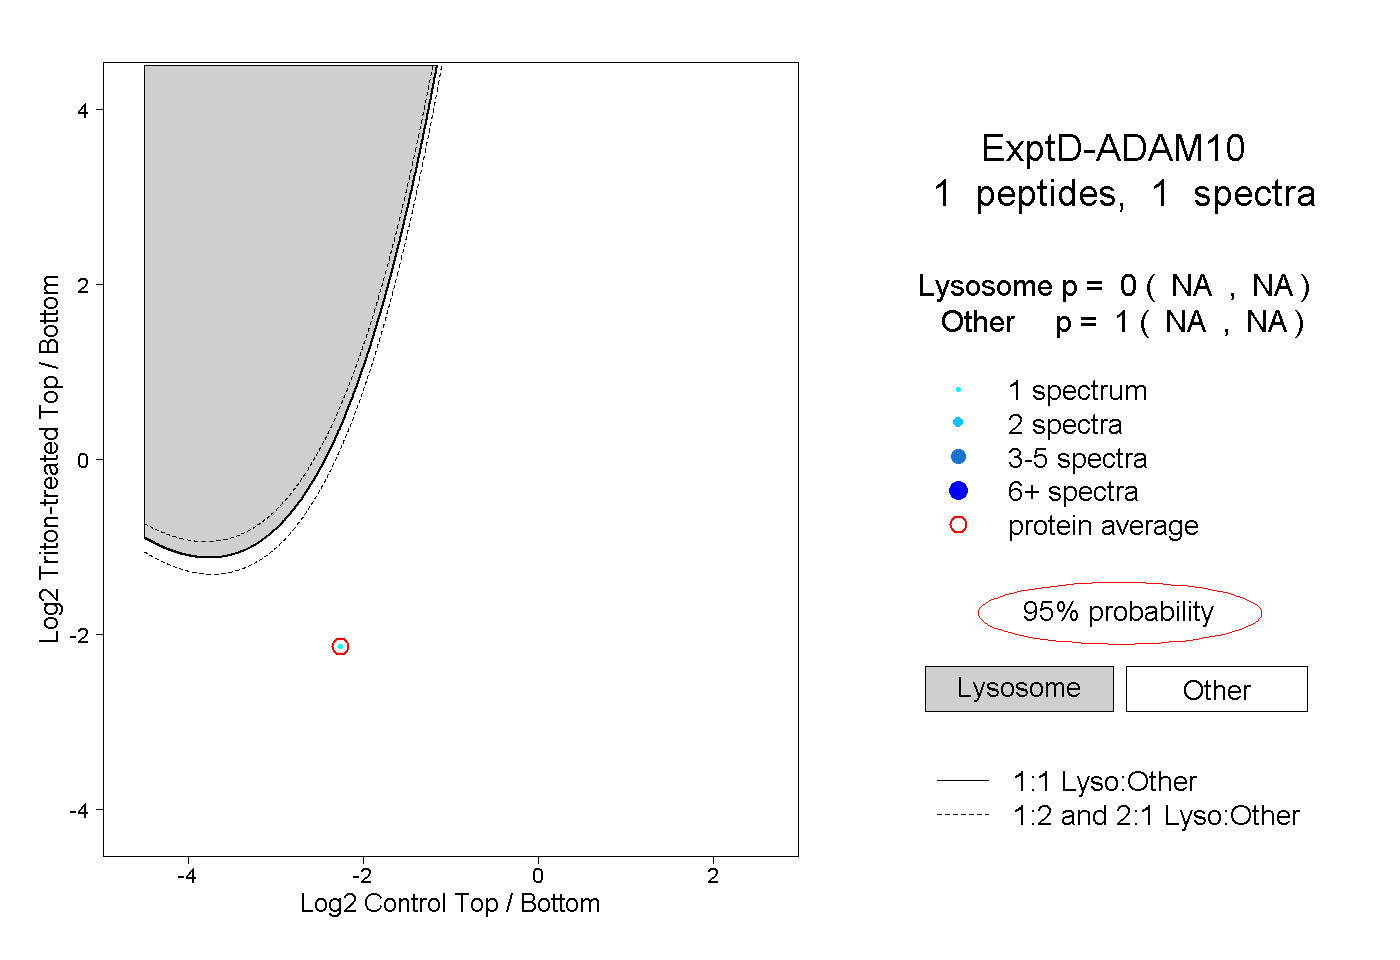
2peptides
spectra
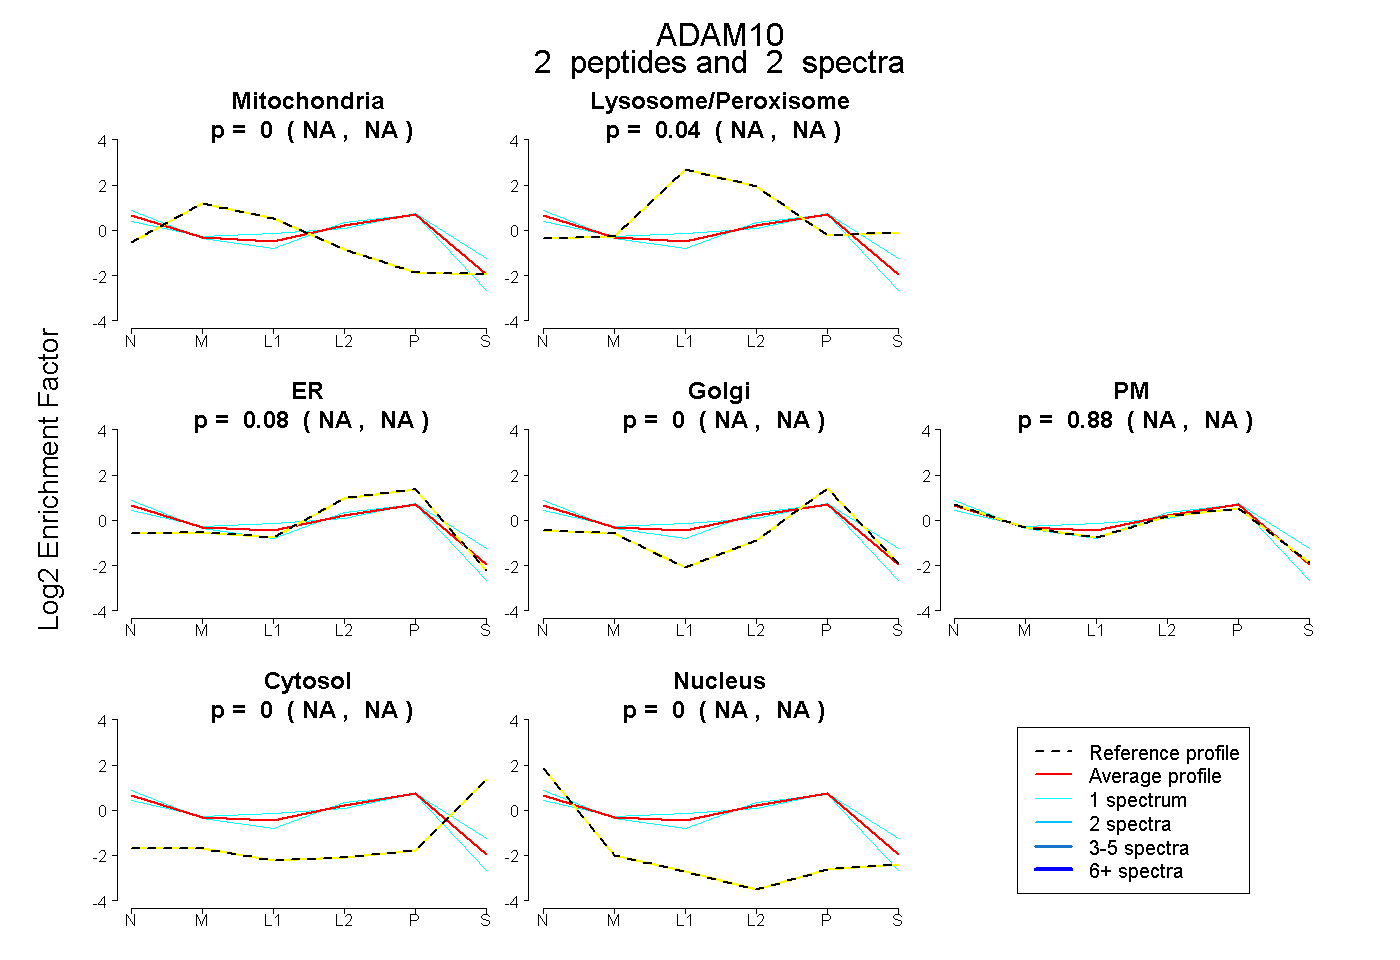
NA | NA
NA | NA
NA | NA
NA | NA
NA | NA
NA | NA
NA | NA
12peptides
spectra
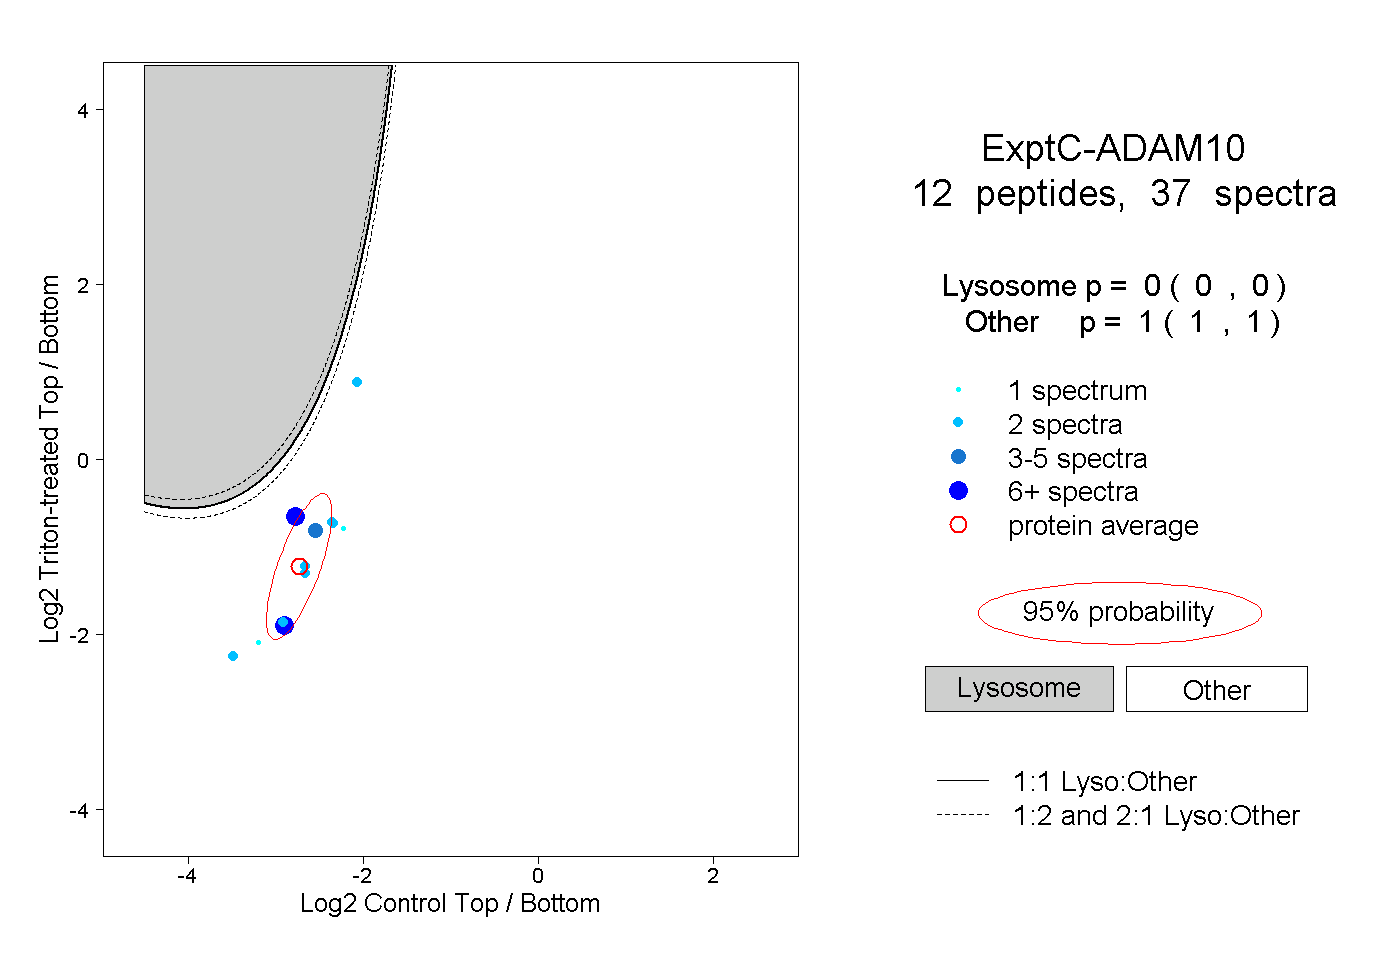
0.000 | 0.000
1.000 | 1.000