 27
27peptides
spectra
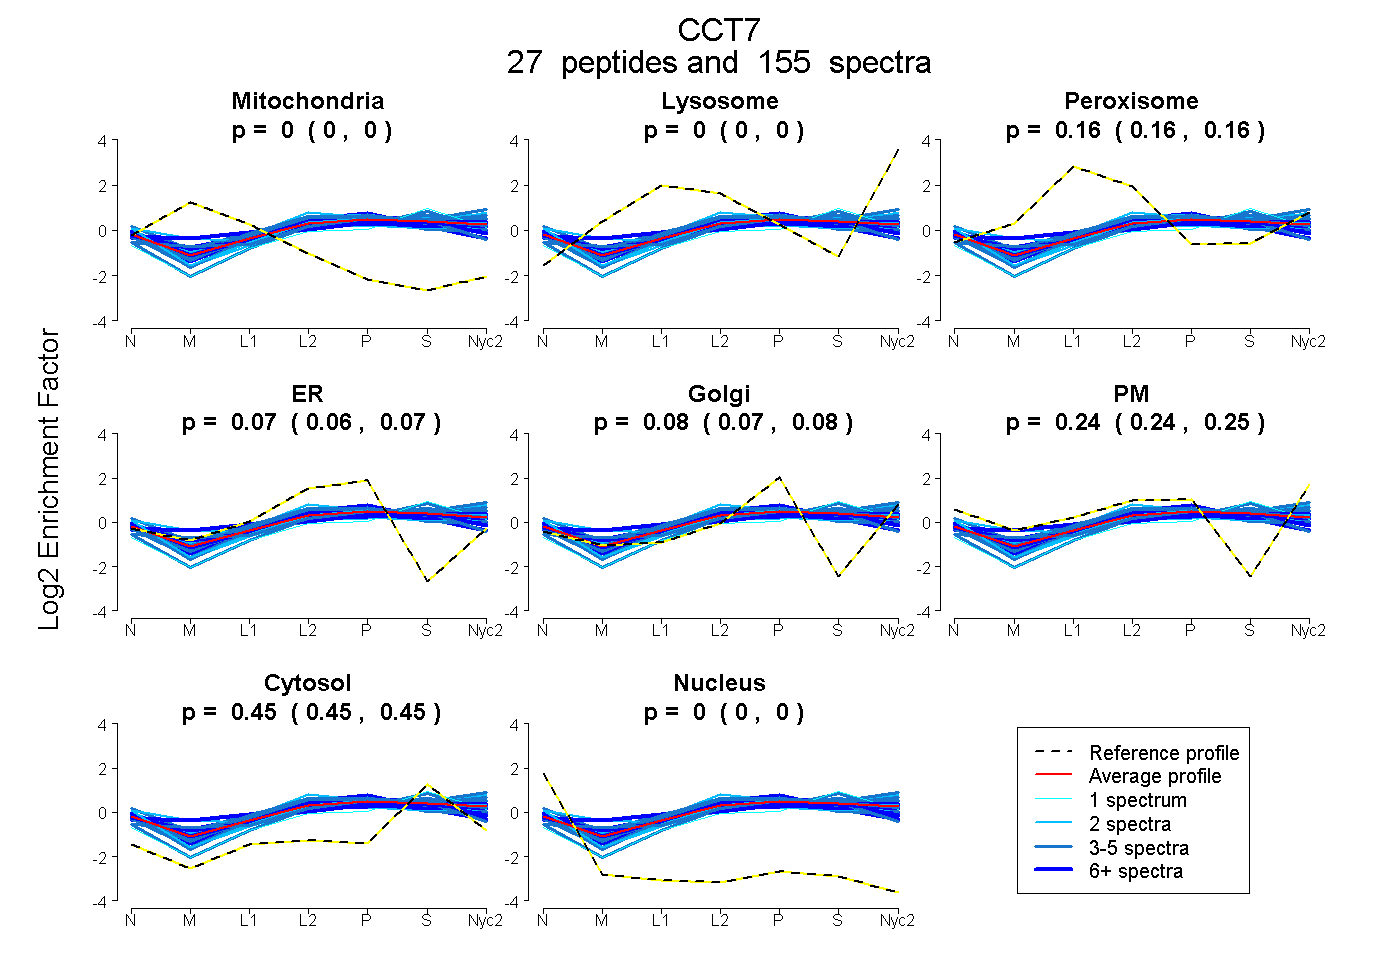
0.000 | 0.000
0.000 | 0.000
0.159 | 0.165
0.063 | 0.072
0.070 | 0.081
0.240 | 0.248
0.448 | 0.452
0.000 | 0.000
19peptides
spectra
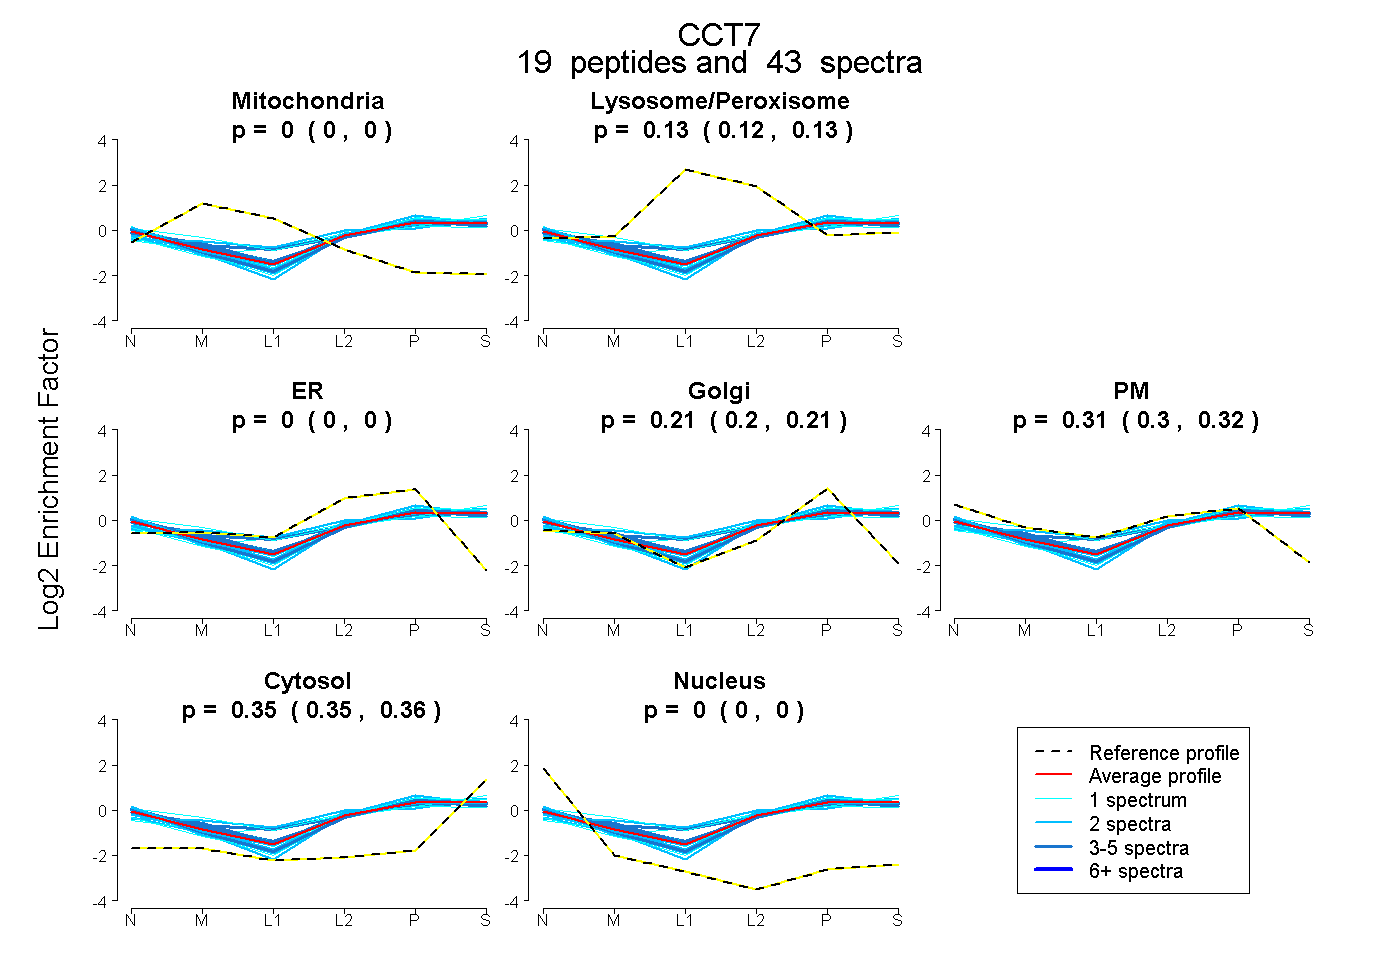
0.000 | 0.000
0.121 | 0.131
0.000 | 0.000
0.202 | 0.215
0.302 | 0.319
0.351 | 0.355
0.000 | 0.000
26peptides
spectra
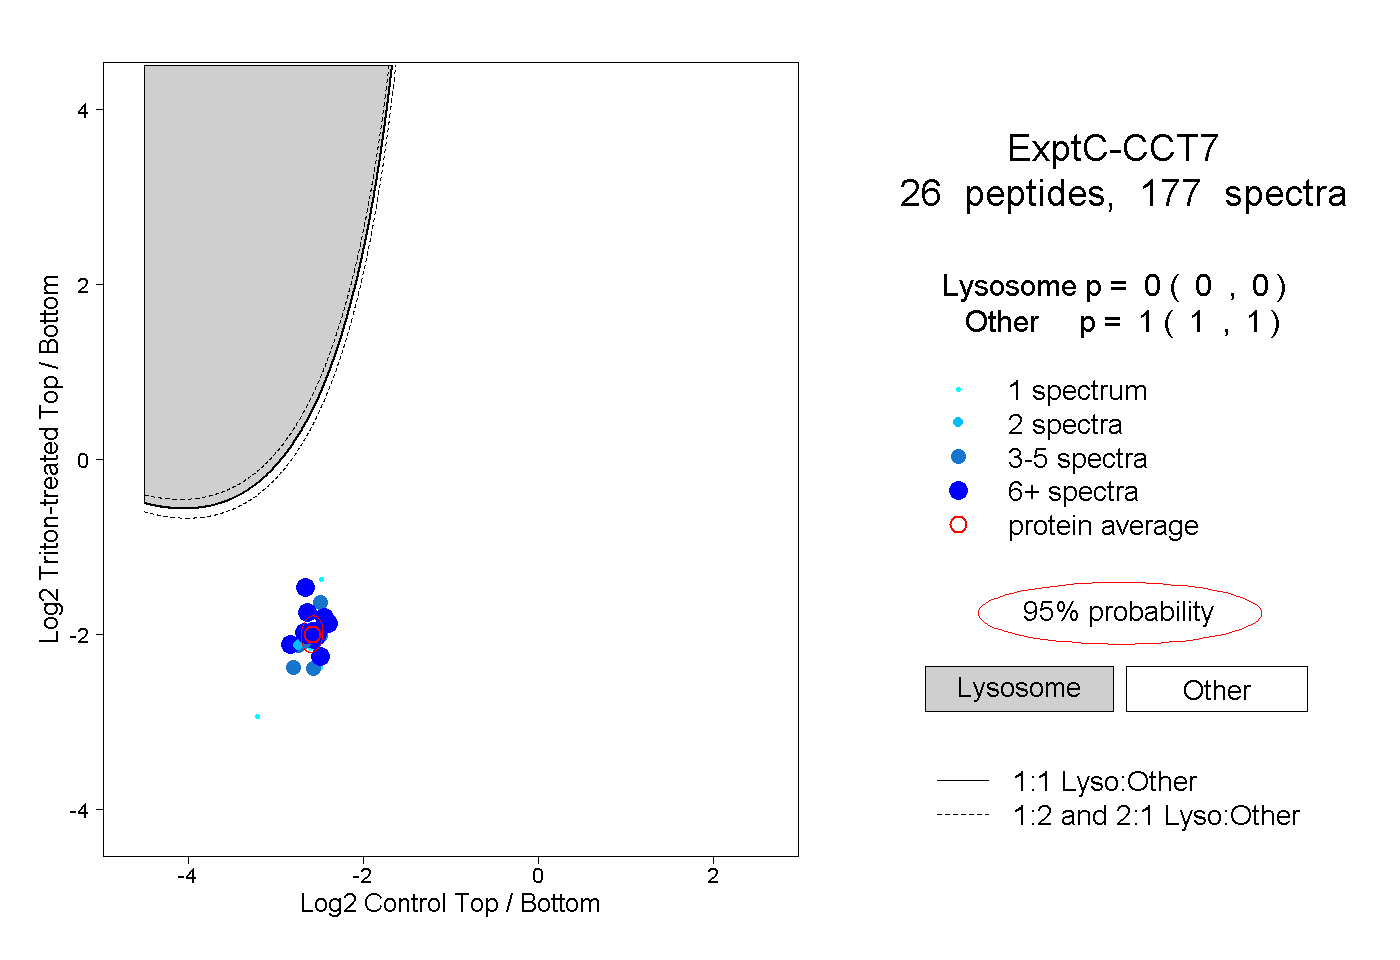
0.000 | 0.000
1.000 | 1.000
18peptides
spectra
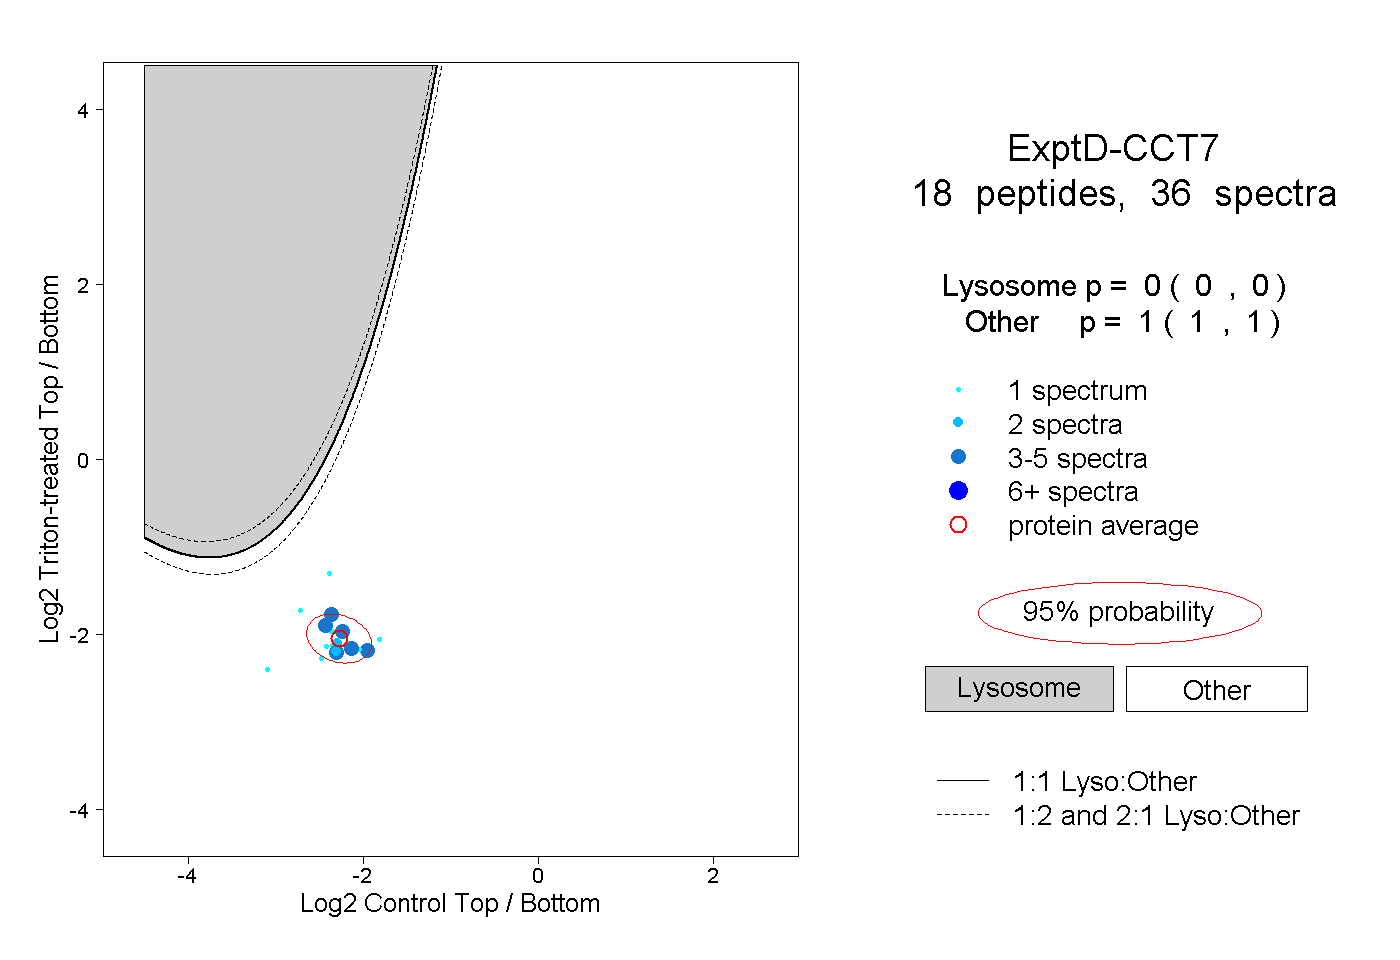
0.000 | 0.000
1.000 | 1.000