11
11peptides
spectra
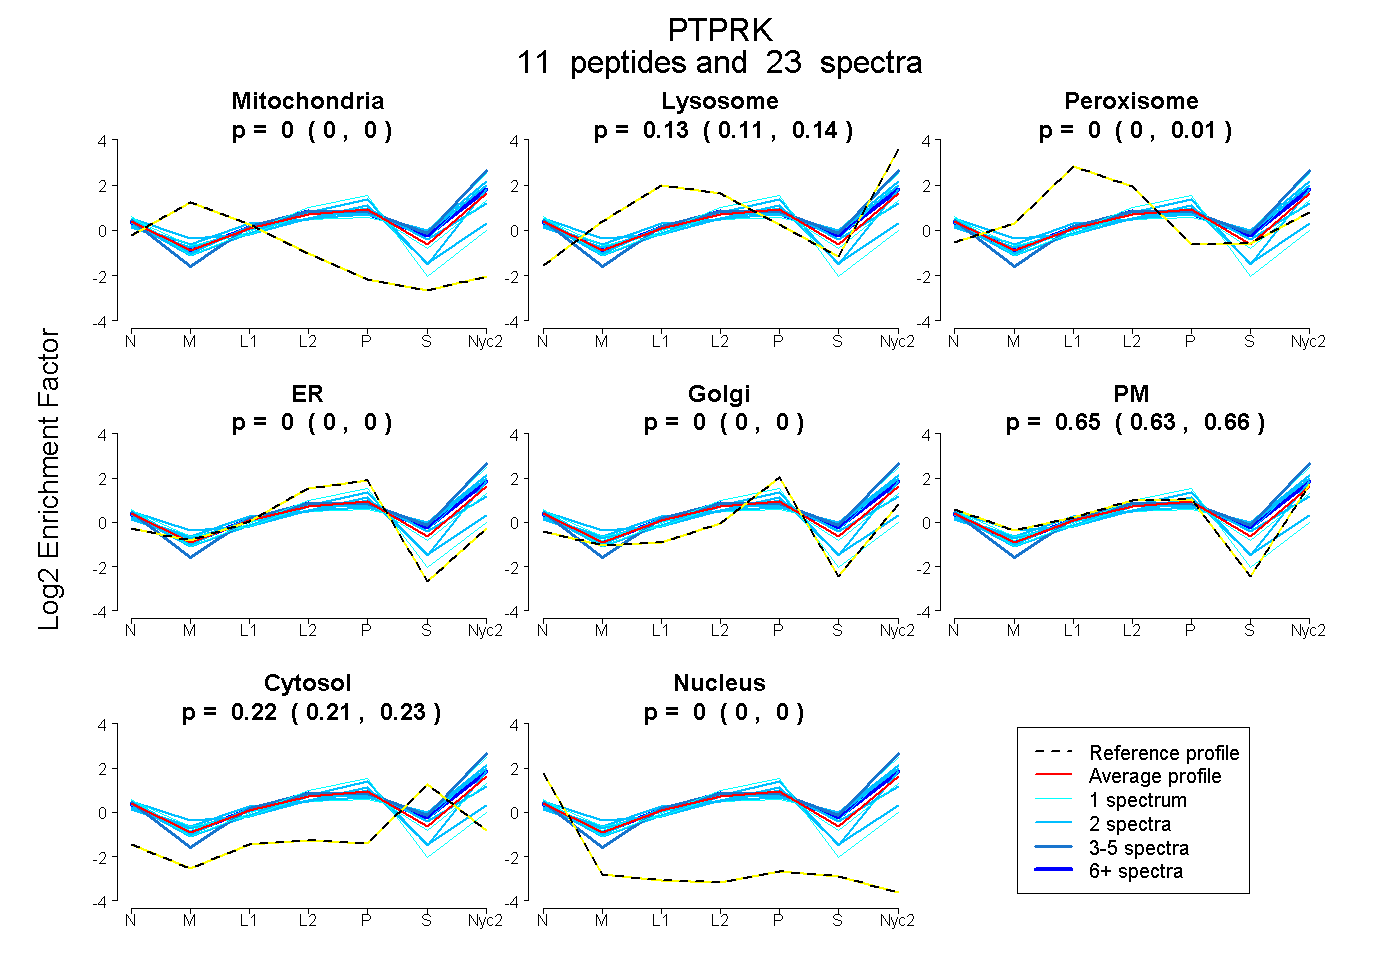
0.000 | 0.000
0.108 | 0.142
0.000 | 0.007
0.000 | 0.000
0.000 | 0.000
0.629 | 0.662
0.213 | 0.232
0.000 | 0.000
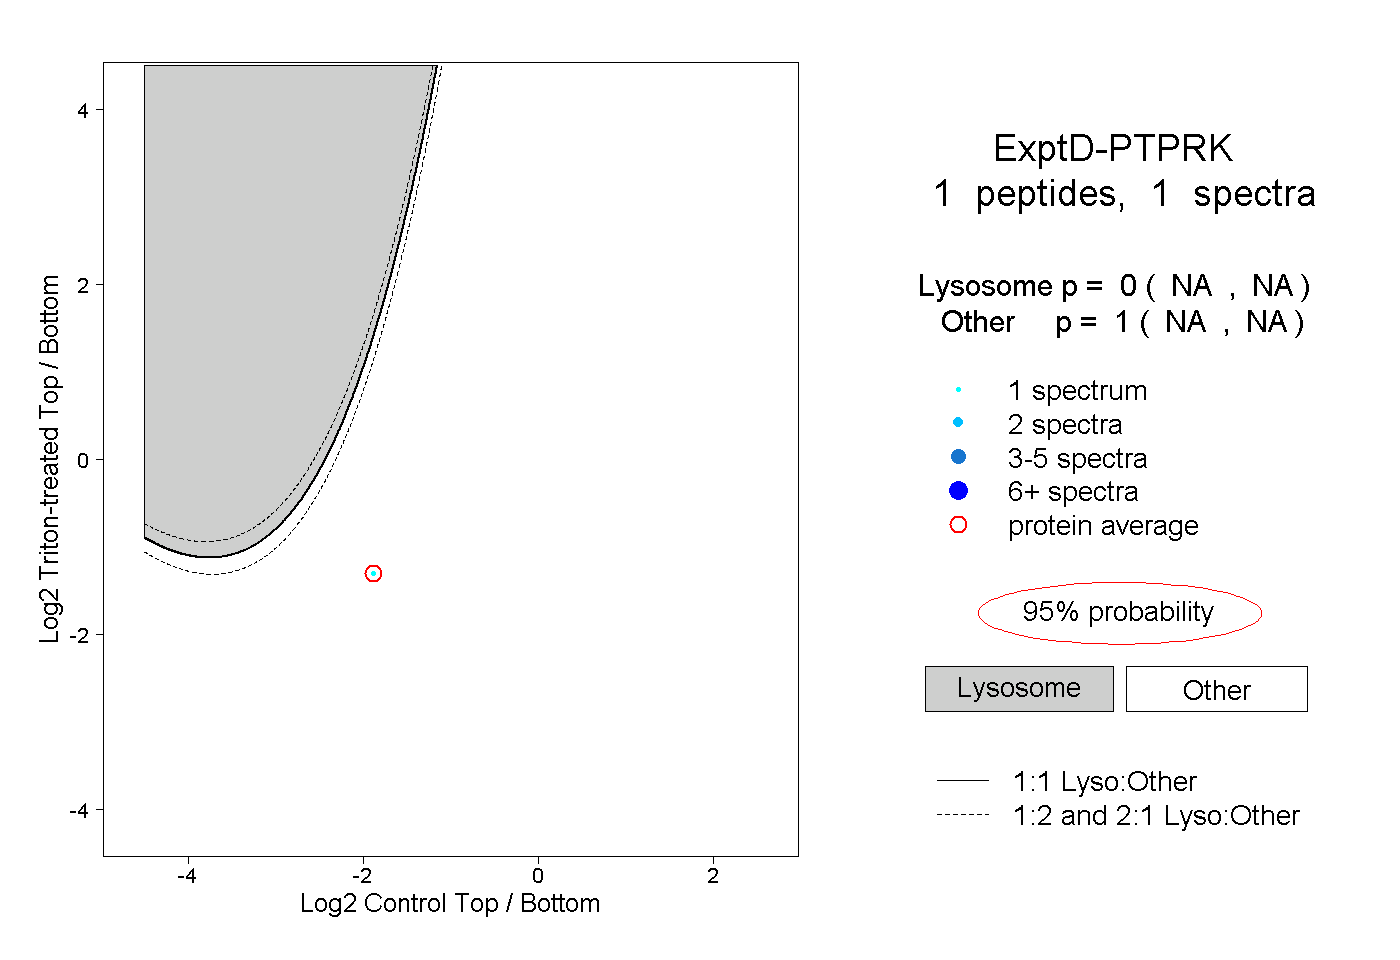
1peptide
spectrum
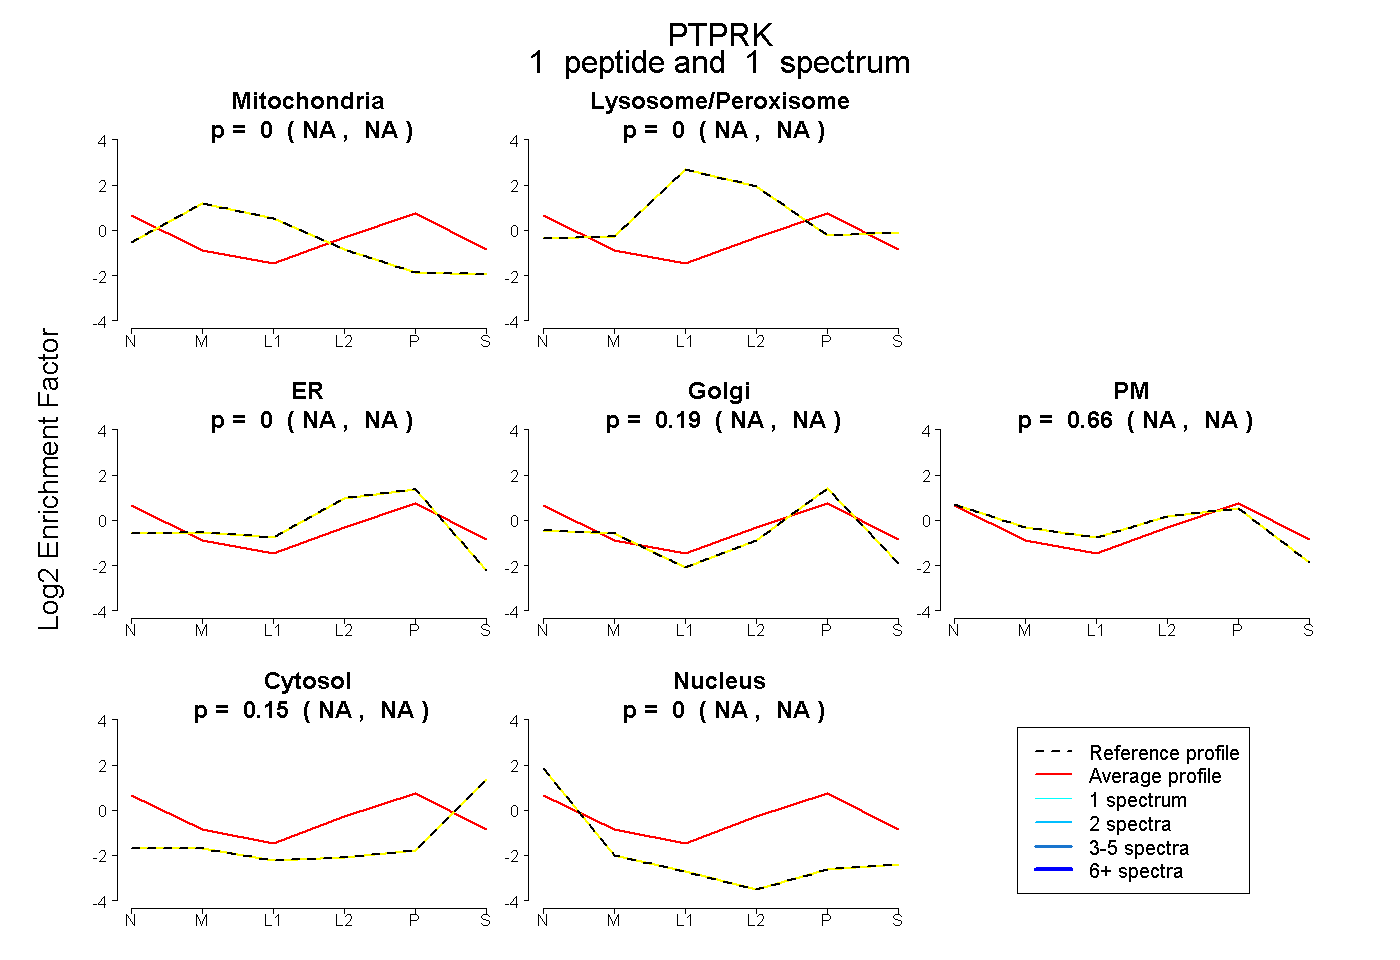
NA | NA
NA | NA
NA | NA
NA | NA
NA | NA
NA | NA
NA | NA
13peptides
spectra
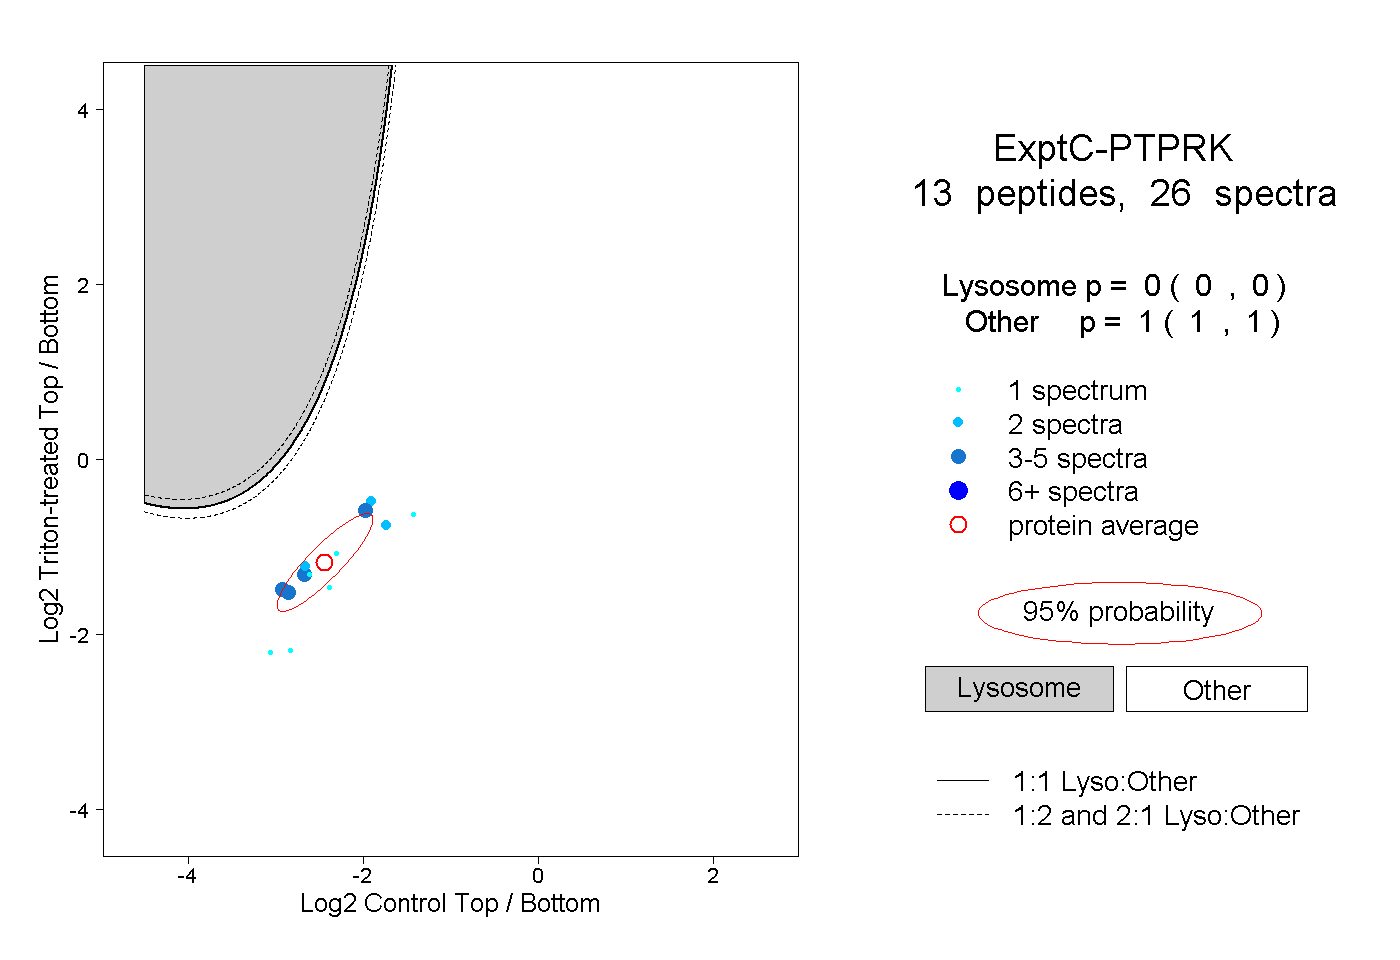
0.000 | 0.000
1.000 | 1.000