11
11peptides
spectra
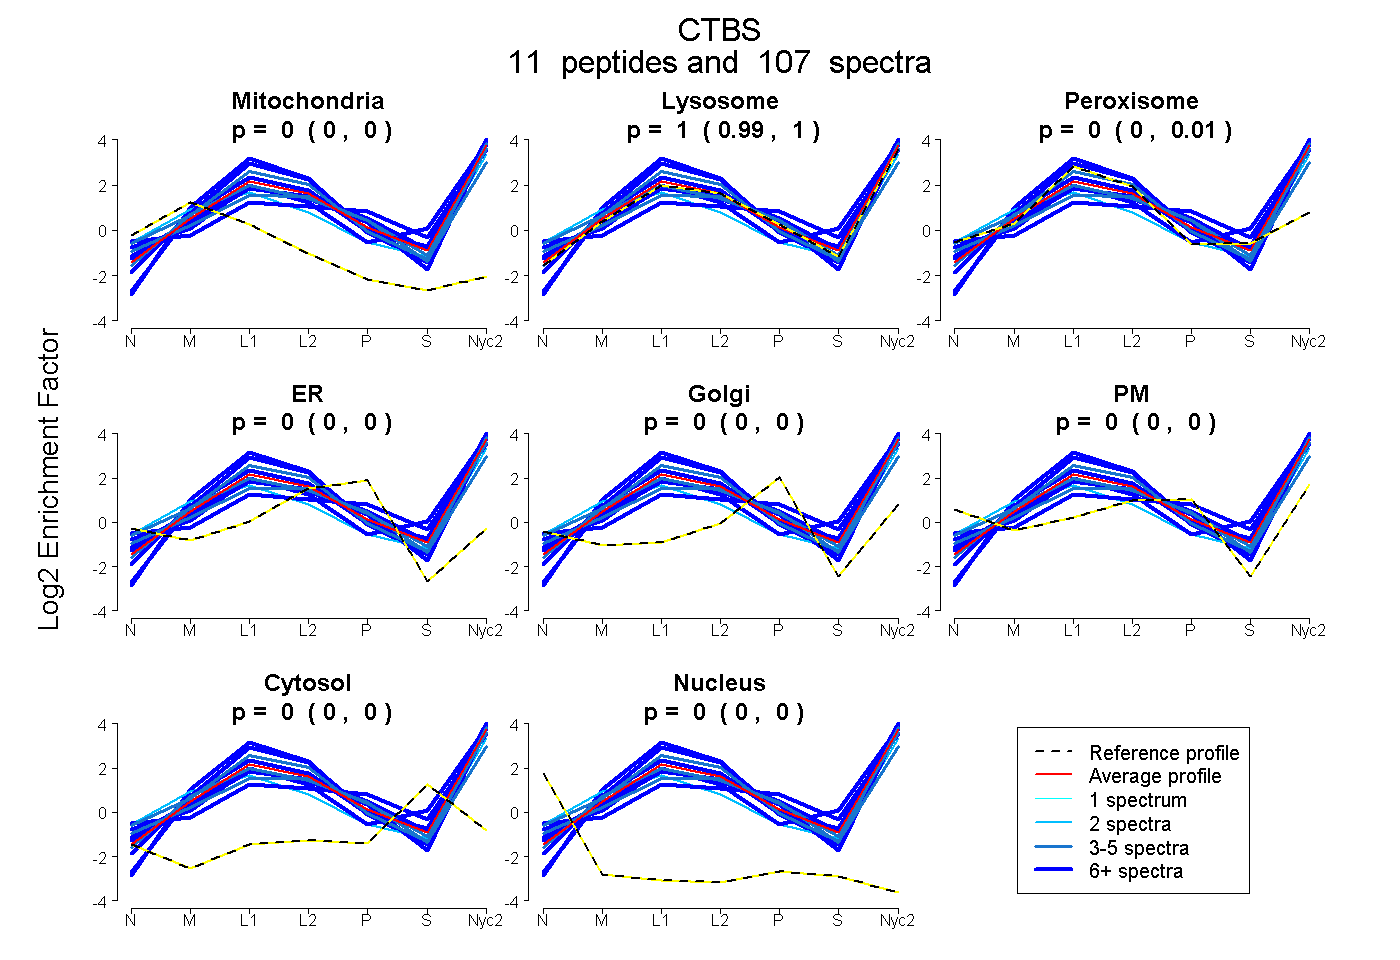
0.000 | 0.000
0.992 | 1.000
0.000 | 0.007
0.000 | 0.000
0.000 | 0.000
0.000 | 0.000
0.000 | 0.000
0.000 | 0.000
9peptides
spectra
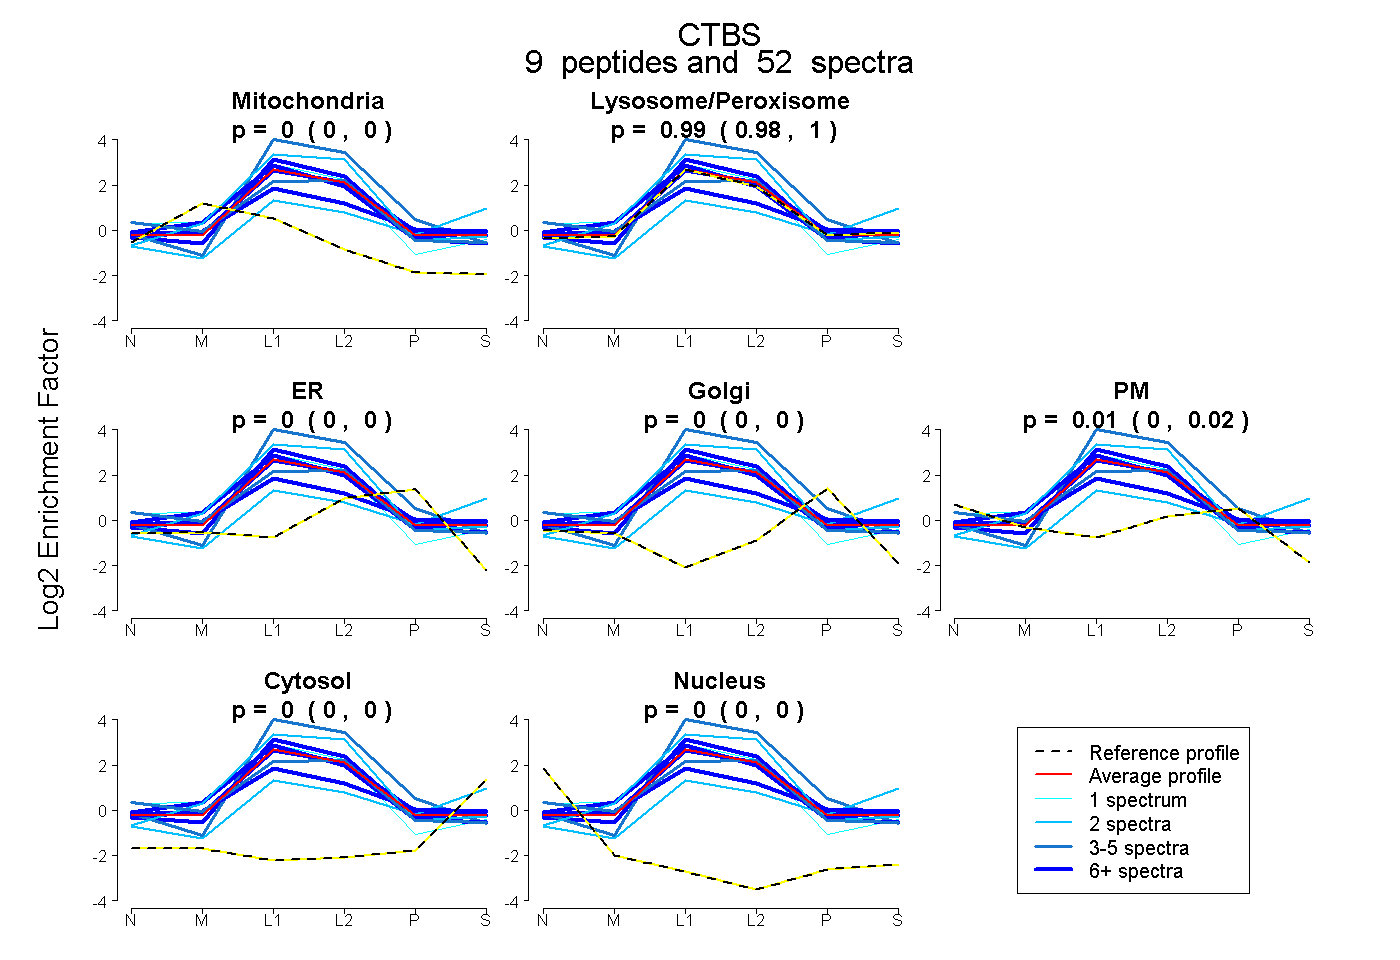
0.000 | 0.000
0.980 | 1.000
0.000 | 0.004
0.000 | 0.000
0.000 | 0.017
0.000 | 0.000
0.000 | 0.000
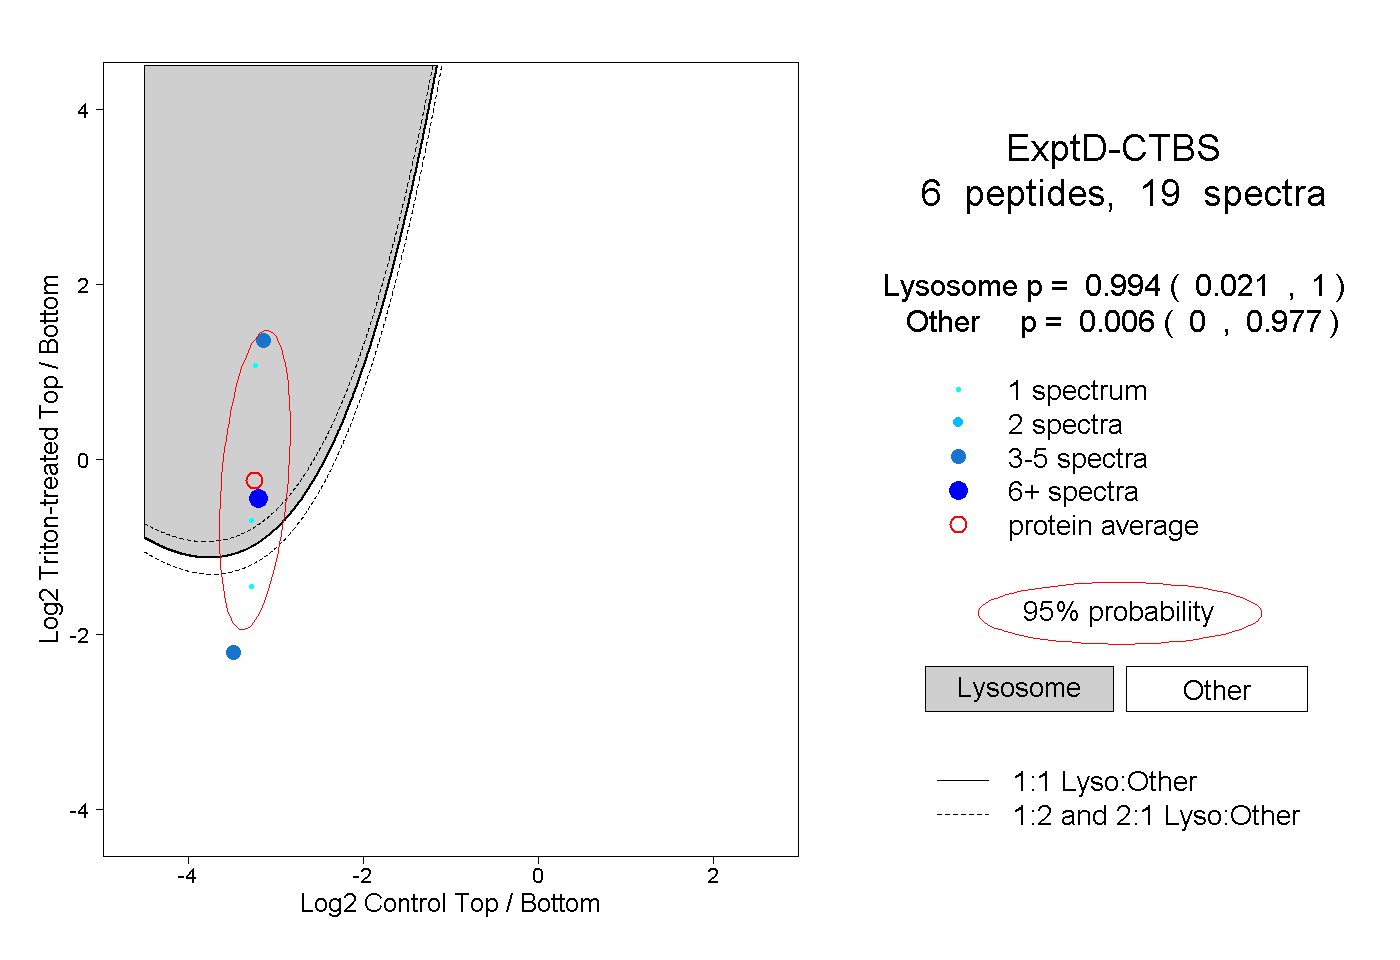
14peptides
spectra
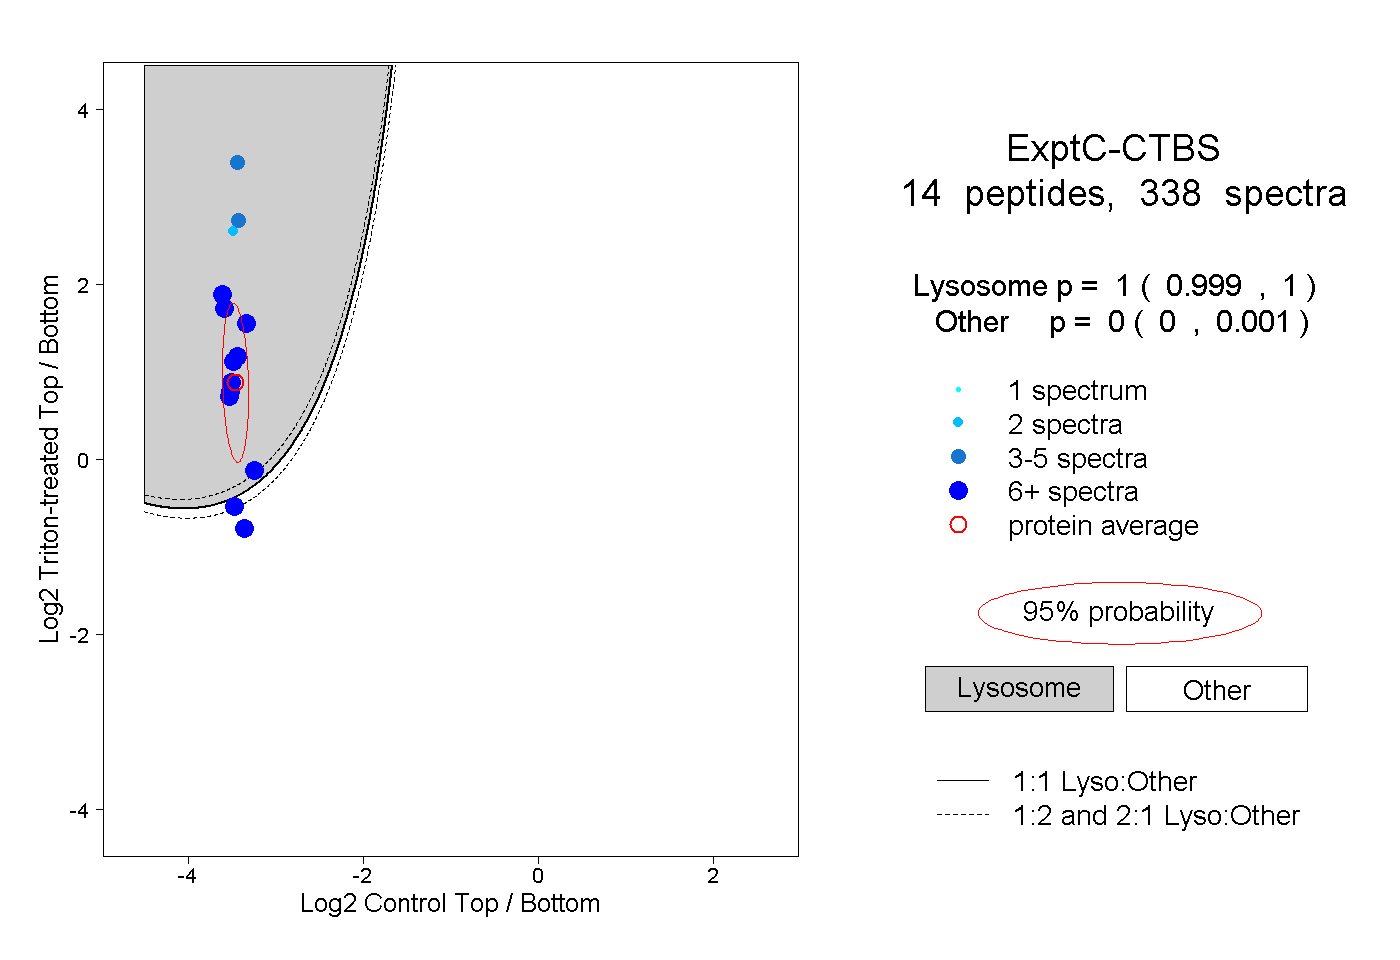
0.999 | 1.000
0.000 | 0.001