 11
11peptides
spectra
0.000 | 0.000
0.992 | 1.000
0.000 | 0.007
0.000 | 0.000
0.000 | 0.000
0.000 | 0.000
0.000 | 0.000
0.000 | 0.000
| Plot | Mito | Lyso | Perox | ER | Golgi | PM | Cytosol | Nucleus | |||||
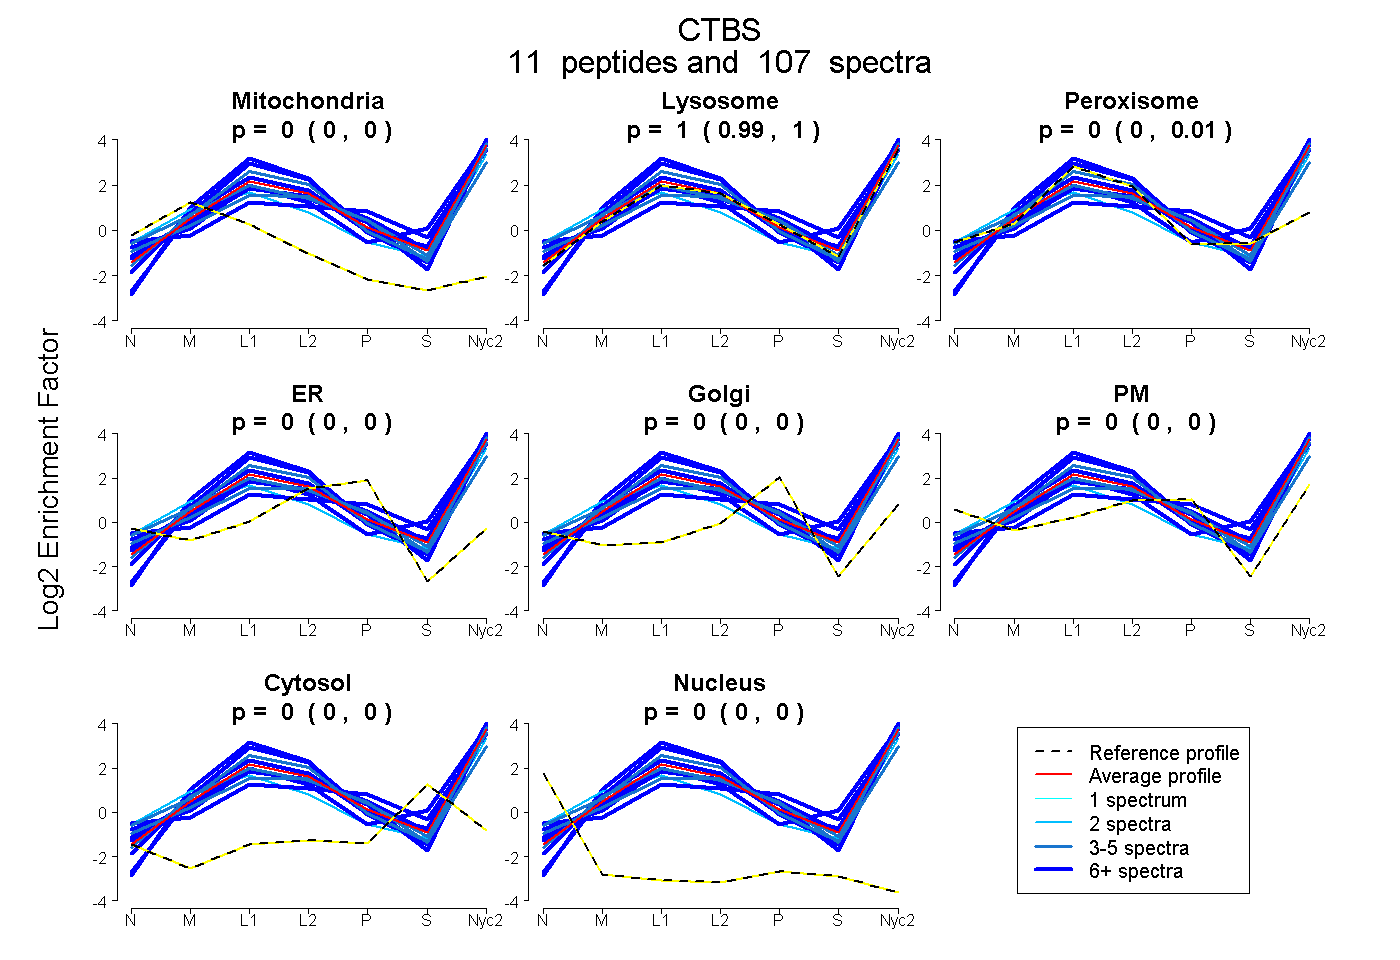
| Expt A |
11 peptides |
107 spectra |
|
0.000 0.000 | 0.000 |
0.999 0.992 | 1.000 |
0.001 0.000 | 0.007 |
0.000 0.000 | 0.000 |
0.000 0.000 | 0.000 |
0.000 0.000 | 0.000 |
0.000 0.000 | 0.000 |
0.000 0.000 | 0.000 |
| 13 spectra, DIINPTFR | 0.000 | 1.000 | 0.000 | 0.000 | 0.000 | 0.000 | 0.000 | 0.000 | ||
| 7 spectra, ETTEGFHR | 0.000 | 0.747 | 0.000 | 0.000 | 0.000 | 0.169 | 0.084 | 0.000 | ||
| 4 spectra, LHQVWYDNPR | 0.000 | 0.846 | 0.000 | 0.000 | 0.000 | 0.154 | 0.000 | 0.000 | ||
| 6 spectra, DFEVFVFDVGQK | 0.000 | 0.899 | 0.000 | 0.000 | 0.000 | 0.101 | 0.000 | 0.000 | ||
| 8 spectra, EQTEEMWGALRPR | 0.000 | 0.986 | 0.000 | 0.000 | 0.000 | 0.014 | 0.000 | 0.000 | ||
| 3 spectra, SYDWSQITTVAVFGK | 0.000 | 1.000 | 0.000 | 0.000 | 0.000 | 0.000 | 0.000 | 0.000 | ||
| 2 spectra, DDVCAIAK | 0.138 | 0.855 | 0.000 | 0.000 | 0.000 | 0.000 | 0.000 | 0.007 | ||
| 41 spectra, MGISPR | 0.000 | 1.000 | 0.000 | 0.000 | 0.000 | 0.000 | 0.000 | 0.000 | ||
| 4 spectra, YDSELMCYAHSK | 0.000 | 0.672 | 0.314 | 0.000 | 0.000 | 0.014 | 0.000 | 0.000 | ||
| 11 spectra, ASWIAQK | 0.000 | 1.000 | 0.000 | 0.000 | 0.000 | 0.000 | 0.000 | 0.000 | ||
| 8 spectra, GAPCSDAAGHQVPYR | 0.000 | 0.882 | 0.034 | 0.000 | 0.000 | 0.000 | 0.083 | 0.000 |
| Plot | Mito | Lyso or Perox | ER | Golgi | PM | Cytosol | Nucleus | ||||||
| Expt B |
9 peptides |
52 spectra |
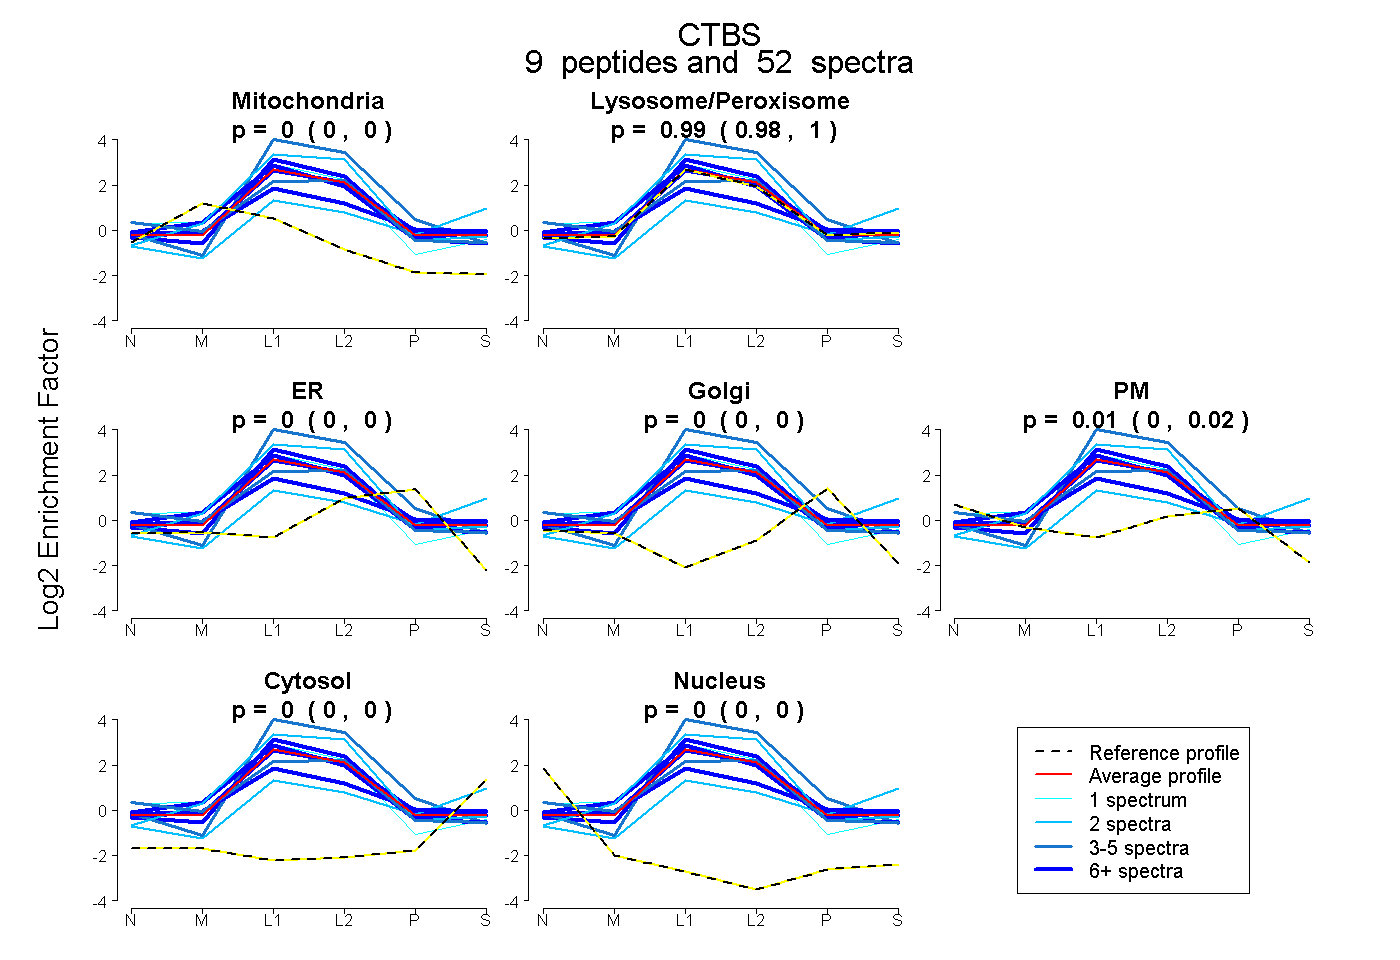 |
0.000 0.000 | 0.000 |
0.993 0.980 | 1.000 |
0.000 0.000 | 0.004 |
0.000 0.000 | 0.000 |
0.007 0.000 | 0.017 |
0.000 0.000 | 0.000 |
0.000 0.000 | 0.000 |
|||
| Plot | Lyso | Other | |||||||||||
| Expt C |
14 peptides |
338 spectra |
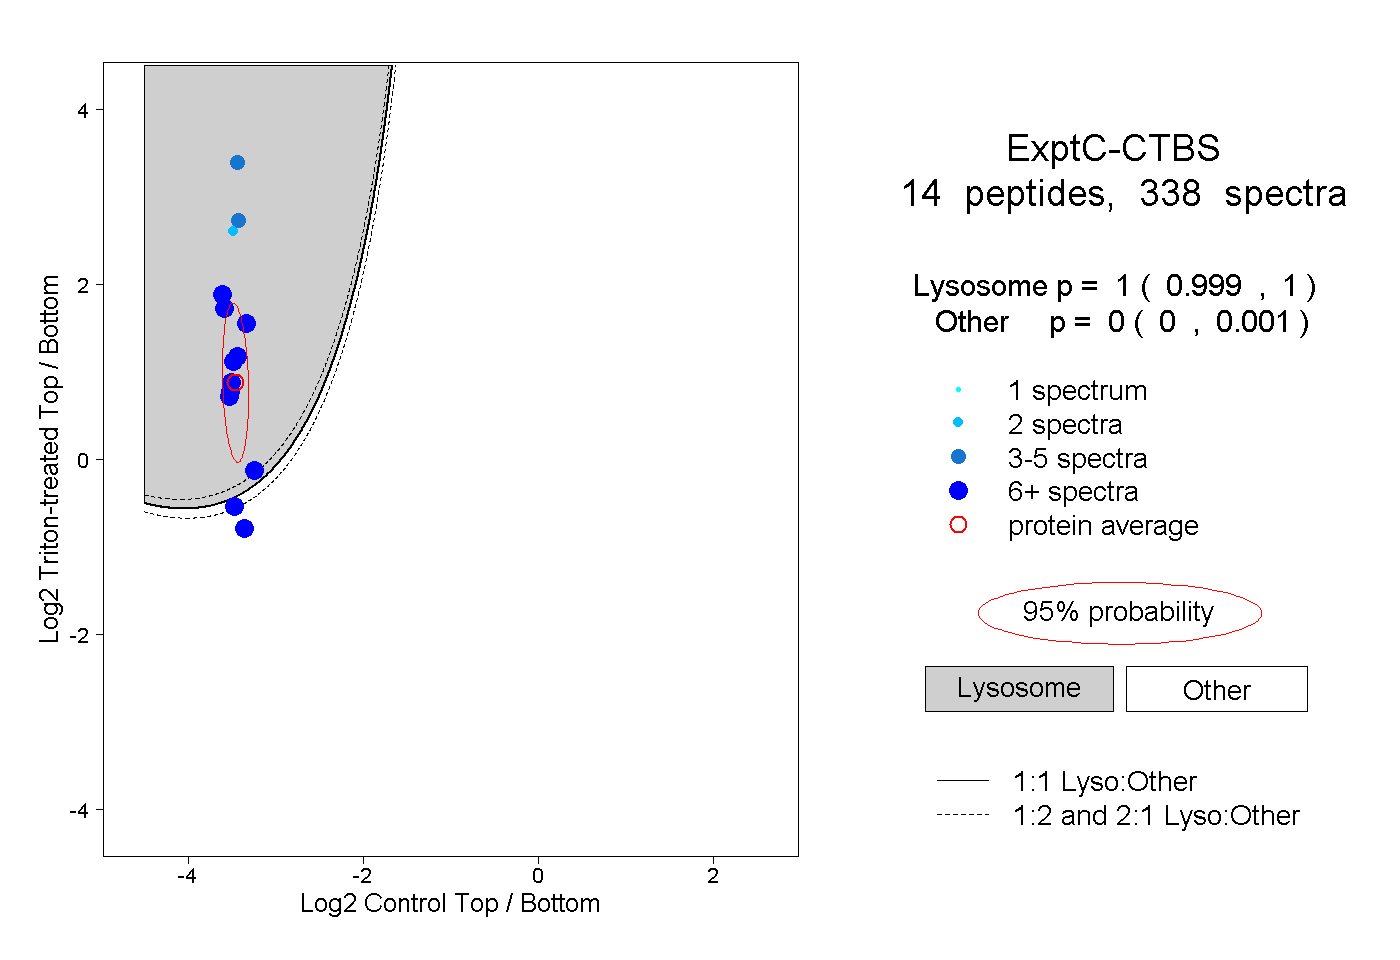 |
1.000 0.999 | 1.000 |
0.000 0.000 | 0.001 |
||||||||
| Plot | Lyso | Other | |||||||||||
| Expt D |
6 peptides |
19 spectra |
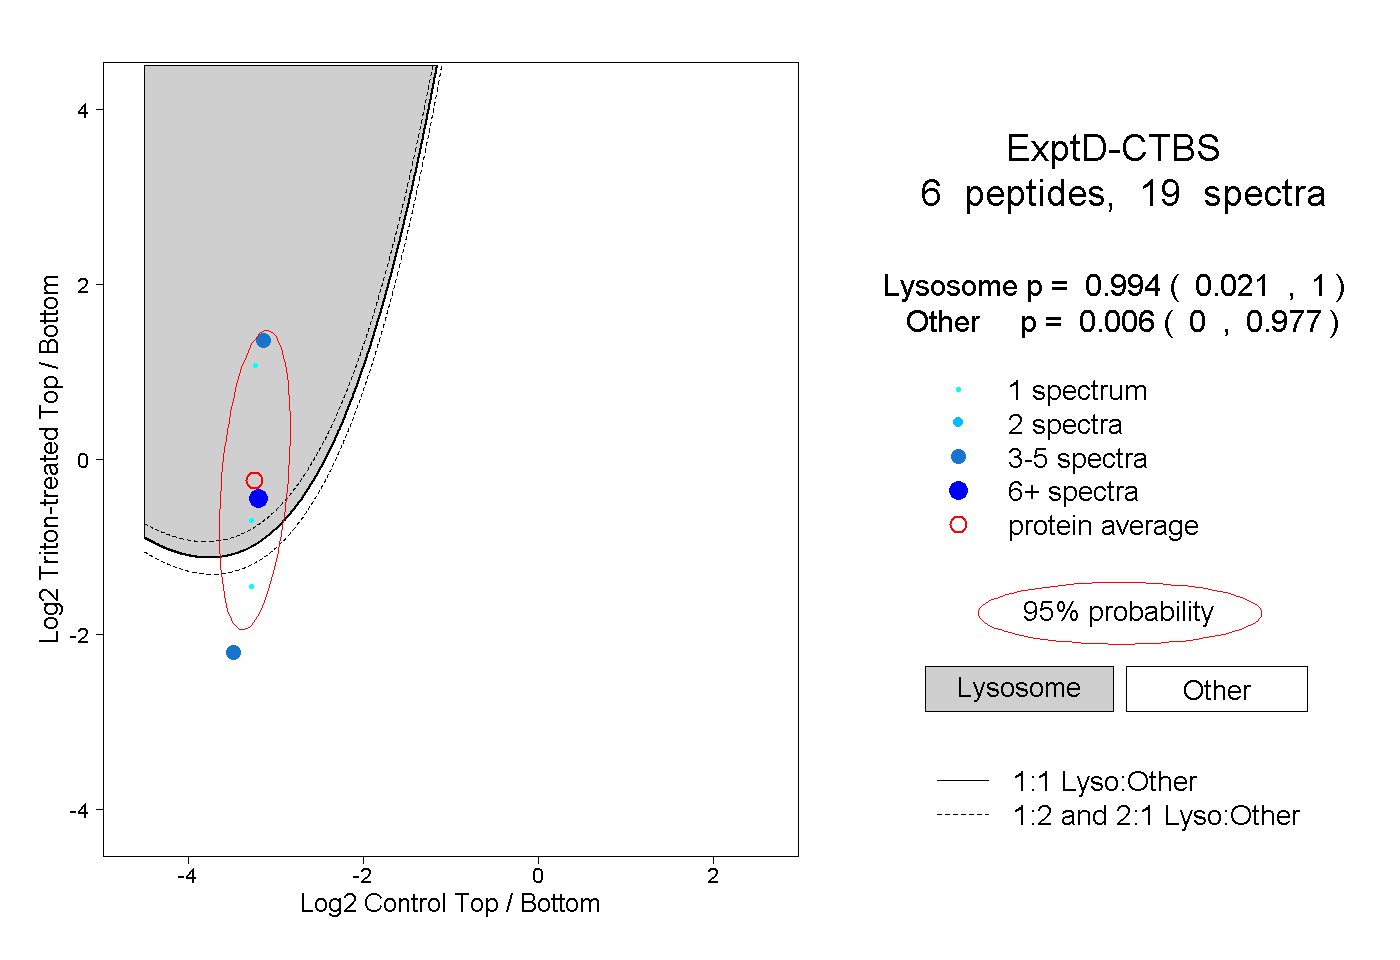 |
0.994 0.021 | 1.000 |
0.006 0.000 | 0.977 |