 7
7peptides
spectra
0.000 | 0.000
0.000 | 0.000
0.000 | 0.121
0.000 | 0.000
0.000 | 0.000
0.329 | 0.480
0.170 | 0.268
0.263 | 0.348
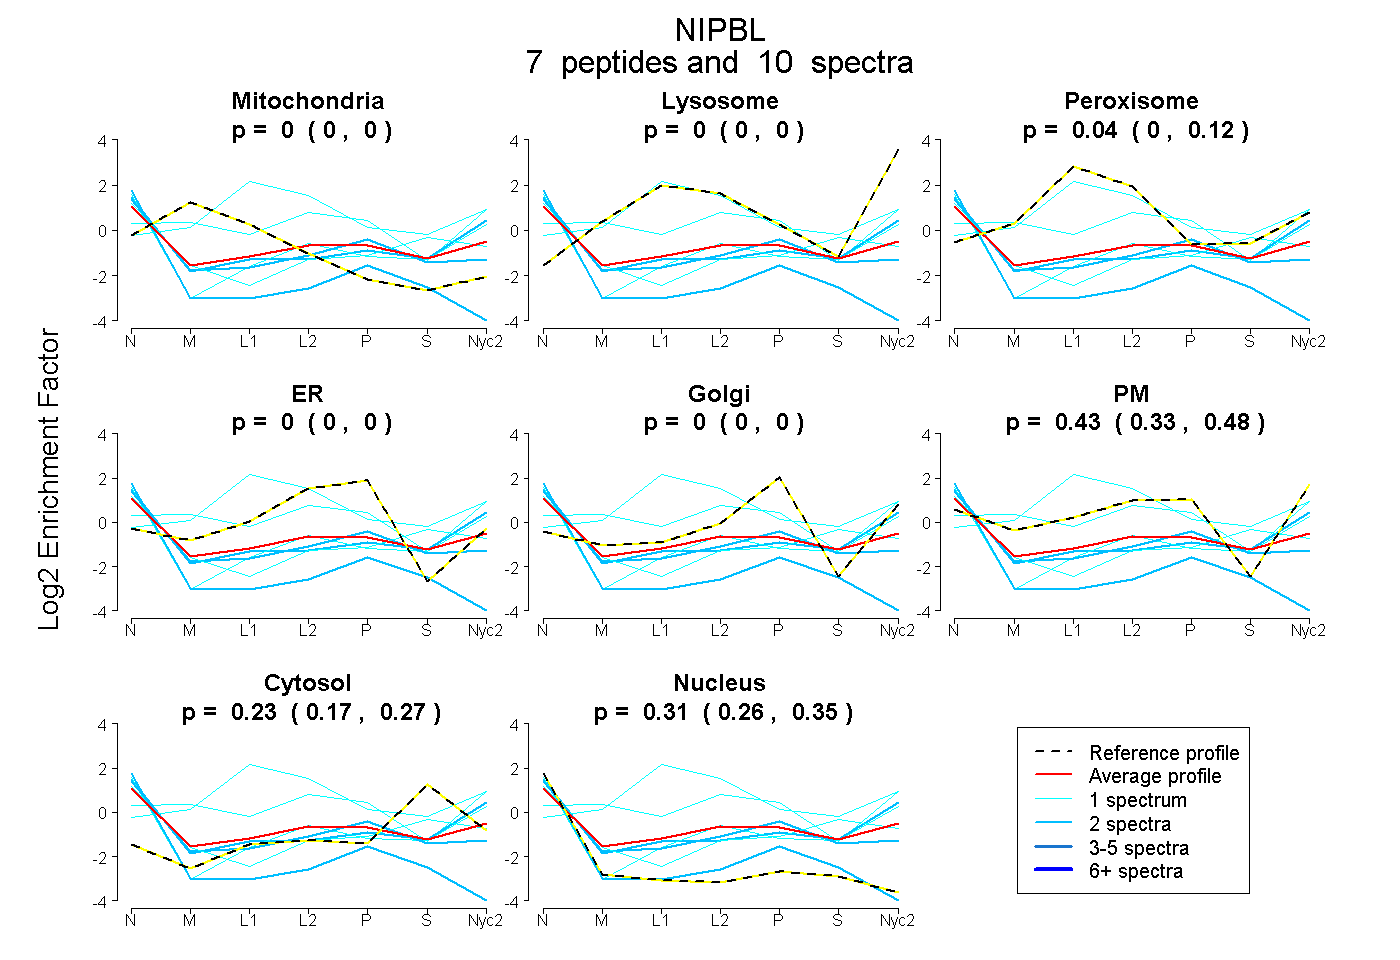
| Plot | Mito | Lyso | Perox | ER | Golgi | PM | Cytosol | Nucleus | |||||
| Expt A |
7 peptides |
10 spectra |
|
0.000 0.000 | 0.000 |
0.000 0.000 | 0.000 |
0.037 0.000 | 0.121 |
0.000 0.000 | 0.000 |
0.000 0.000 | 0.000 |
0.429 0.329 | 0.480 |
0.227 0.170 | 0.268 |
0.307 0.263 | 0.348 |