10
10peptides
spectra
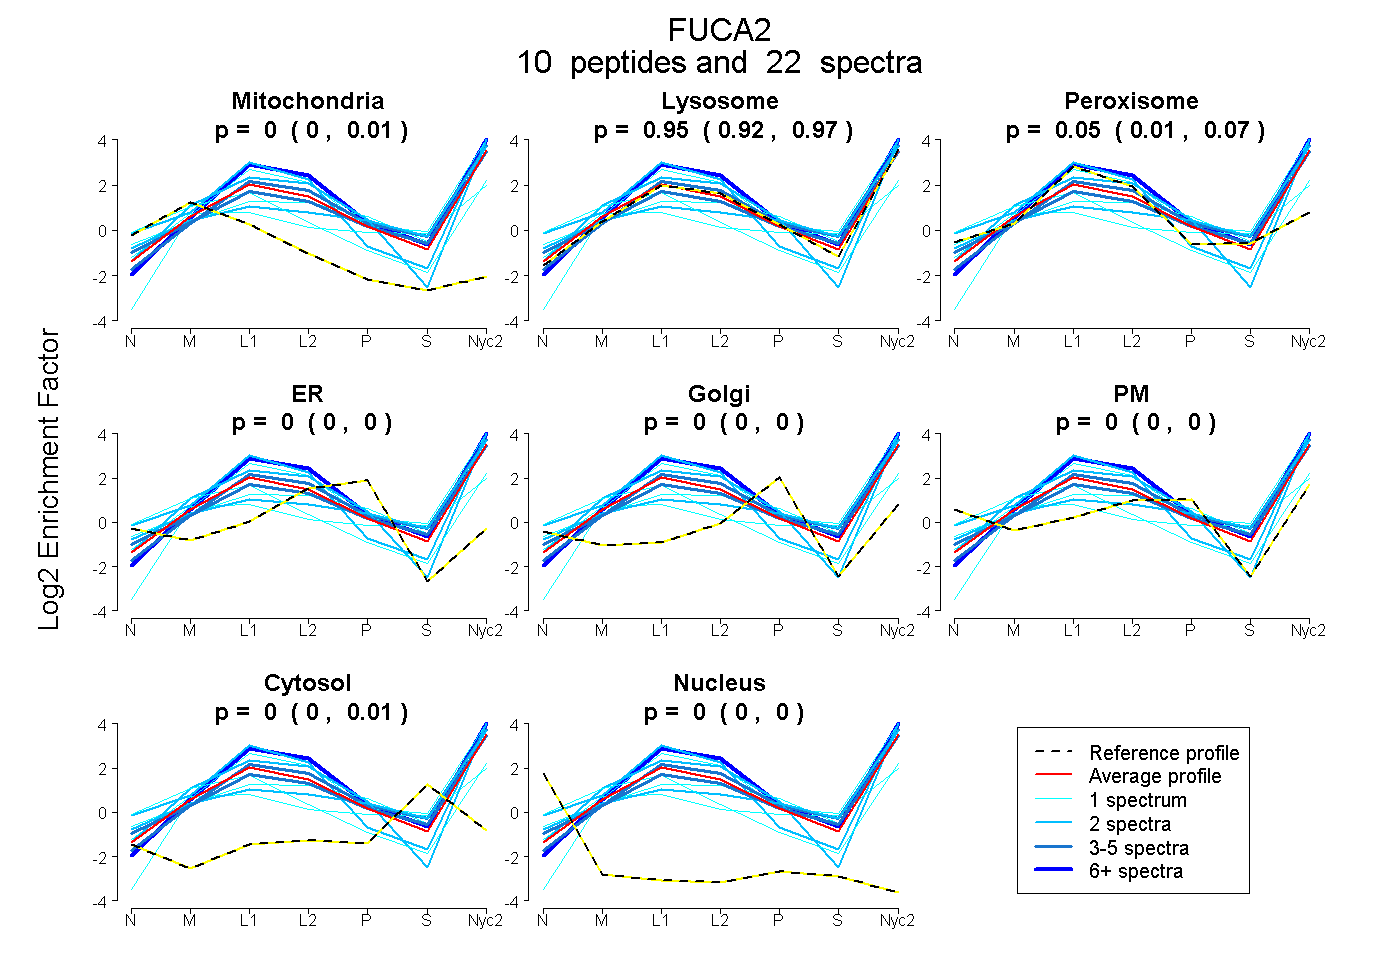
0.000 | 0.010
0.921 | 0.974
0.011 | 0.071
0.000 | 0.000
0.000 | 0.000
0.000 | 0.000
0.000 | 0.014
0.000 | 0.000
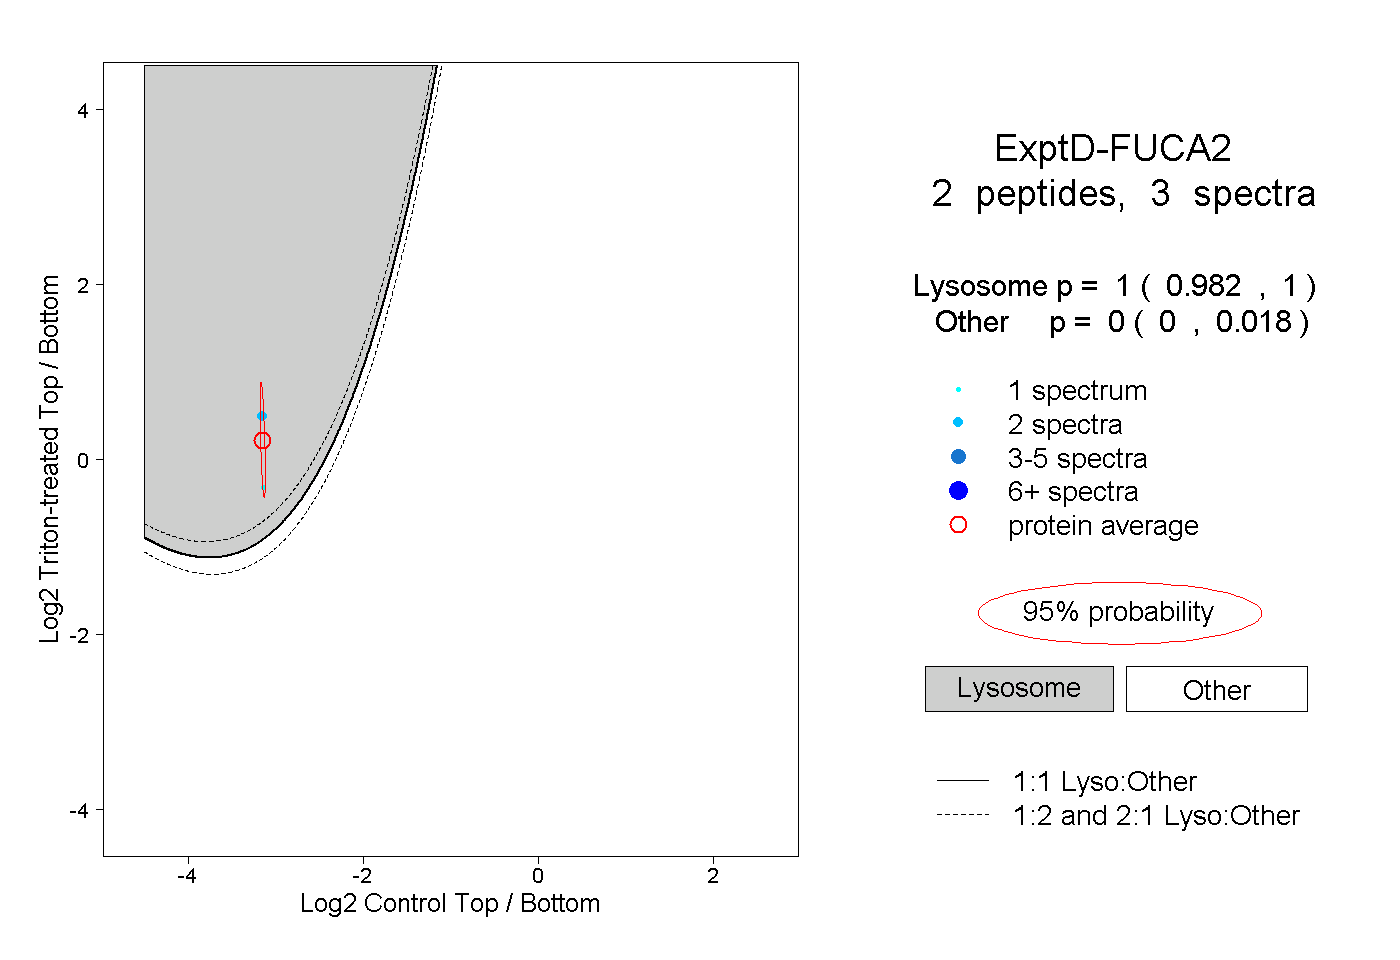
2peptides
spectra
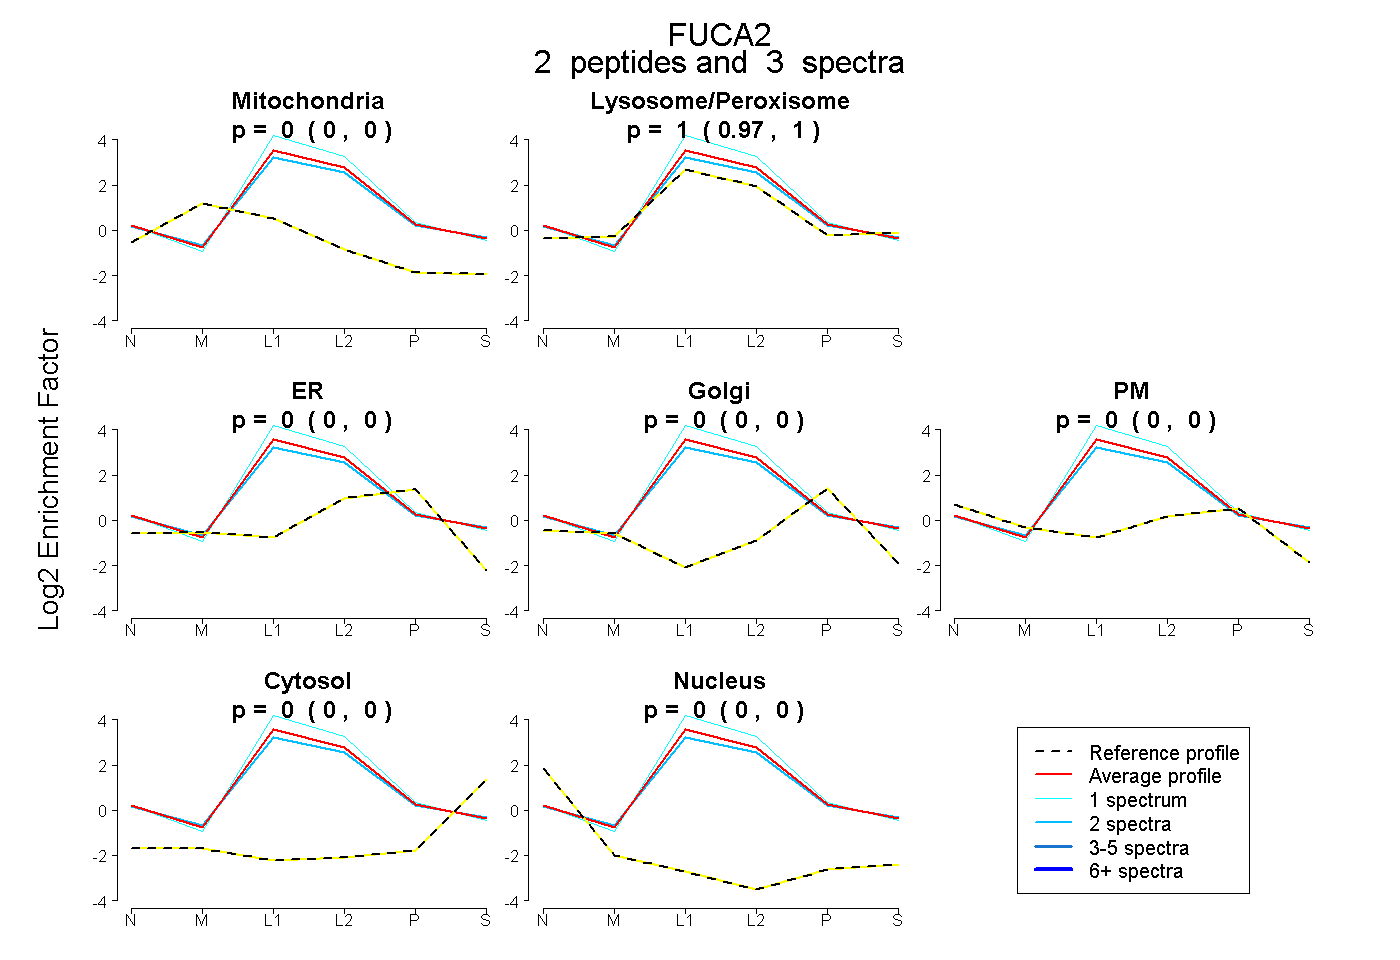
0.000 | 0.000
0.970 | 1.000
0.000 | 0.000
0.000 | 0.000
0.000 | 0.000
0.000 | 0.000
0.000 | 0.000
16peptides
spectra
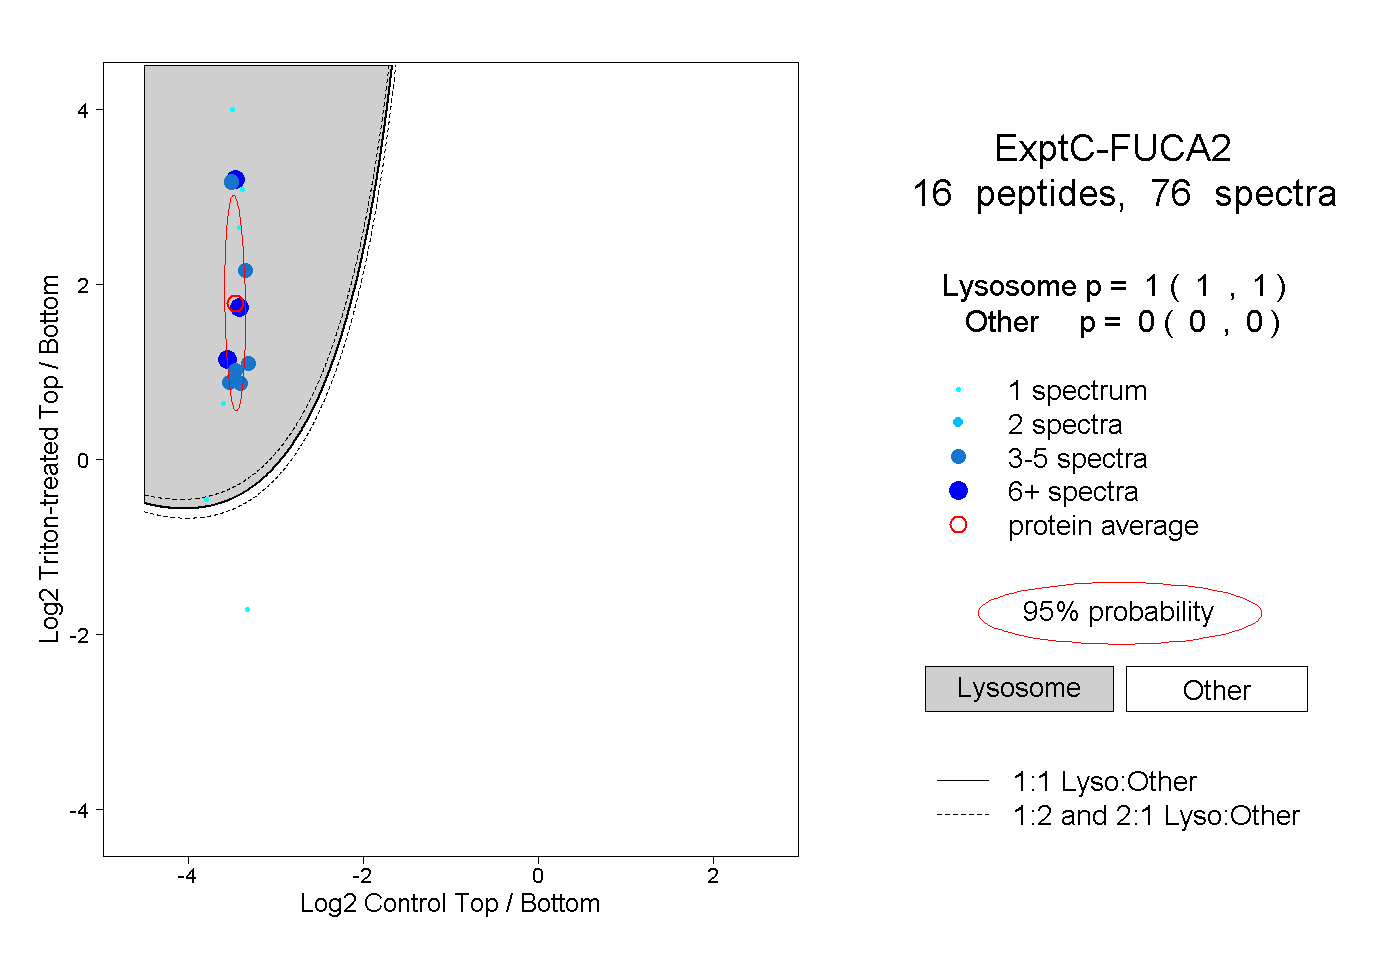
1.000 | 1.000
0.000 | 0.000