 10
10peptides
spectra
0.000 | 0.010
0.921 | 0.974
0.011 | 0.071
0.000 | 0.000
0.000 | 0.000
0.000 | 0.000
0.000 | 0.014
0.000 | 0.000
| Plot | Mito | Lyso | Perox | ER | Golgi | PM | Cytosol | Nucleus | |||||
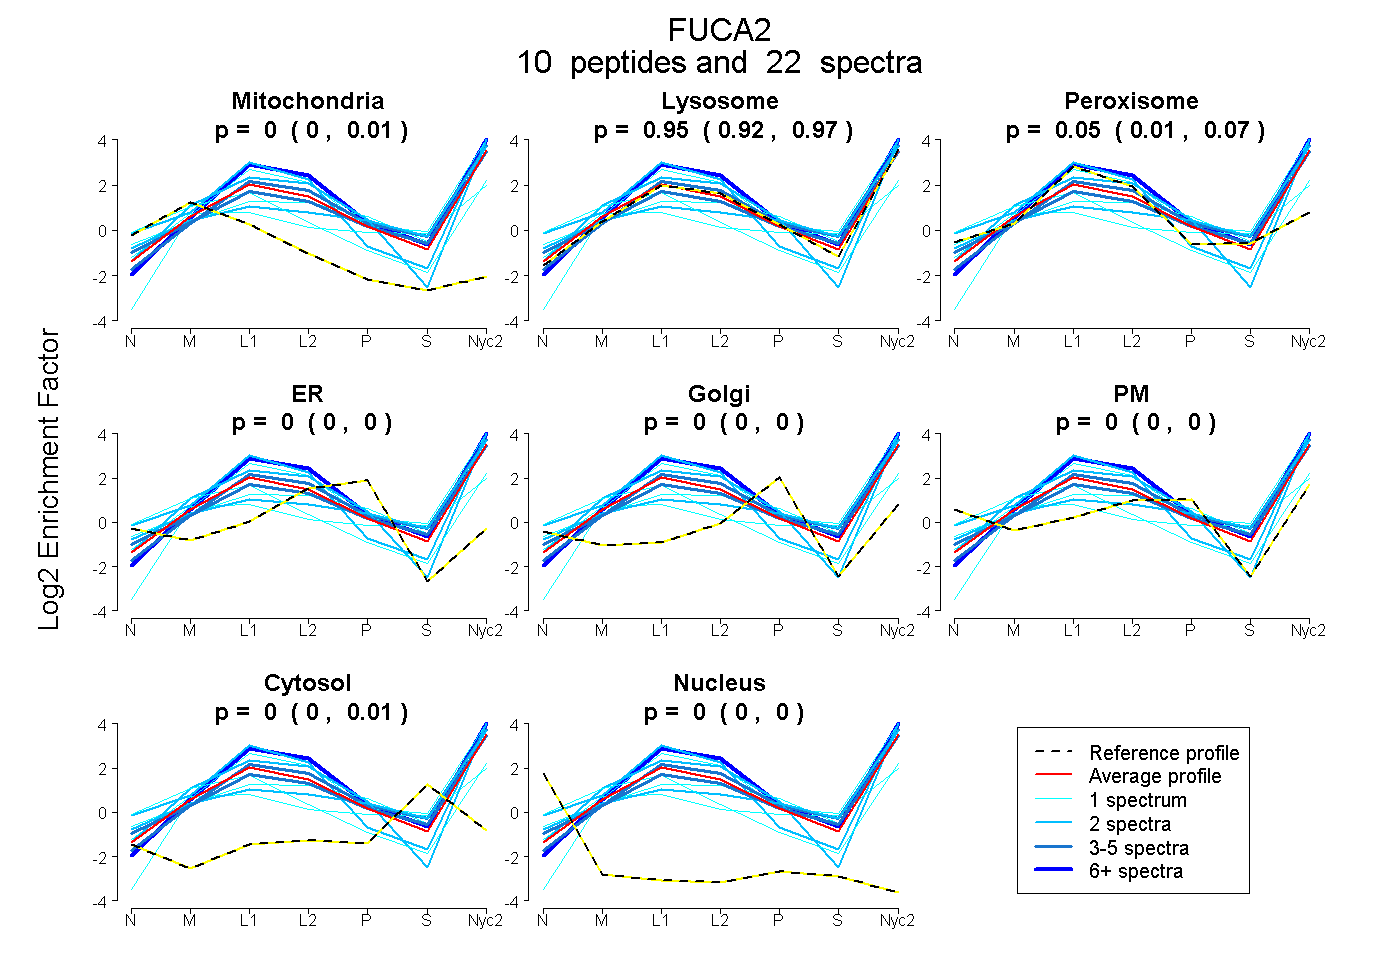
| Expt A |
10 peptides |
22 spectra |
|
0.000 0.000 | 0.010 |
0.949 0.921 | 0.974 |
0.048 0.011 | 0.071 |
0.000 0.000 | 0.000 |
0.000 0.000 | 0.000 |
0.000 0.000 | 0.000 |
0.003 0.000 | 0.014 |
0.000 0.000 | 0.000 |
| 6 spectra, DTVVTNDR | 0.000 | 1.000 | 0.000 | 0.000 | 0.000 | 0.000 | 0.000 | 0.000 | ||
| 1 spectrum, FVDFMDNNYPPGFK | 0.130 | 0.646 | 0.000 | 0.000 | 0.000 | 0.000 | 0.224 | 0.000 | ||
| 1 spectrum, QMGTWLK | 0.000 | 1.000 | 0.000 | 0.000 | 0.000 | 0.000 | 0.000 | 0.000 | ||
| 2 spectra, VNGEAIYETHTWR | 0.000 | 0.821 | 0.000 | 0.000 | 0.000 | 0.075 | 0.104 | 0.000 | ||
| 3 spectra, TLPELYELVTK | 0.000 | 0.994 | 0.000 | 0.000 | 0.000 | 0.000 | 0.006 | 0.000 | ||
| 1 spectrum, WGAGSICK | 0.324 | 0.625 | 0.000 | 0.000 | 0.000 | 0.050 | 0.000 | 0.000 | ||
| 3 spectra, YNPGHLLPHK | 0.000 | 0.909 | 0.007 | 0.000 | 0.000 | 0.017 | 0.067 | 0.000 | ||
| 1 spectrum, RPLPAWFDQAK | 0.000 | 0.785 | 0.000 | 0.000 | 0.000 | 0.162 | 0.053 | 0.000 | ||
| 2 spectra, WENCMTIDK | 0.000 | 0.999 | 0.000 | 0.000 | 0.000 | 0.001 | 0.000 | 0.000 | ||
| 2 spectra, FSWGYR | 0.000 | 0.833 | 0.167 | 0.000 | 0.000 | 0.000 | 0.000 | 0.000 |
| Plot | Mito | Lyso or Perox | ER | Golgi | PM | Cytosol | Nucleus | ||||||
| Expt B |
2 peptides |
3 spectra |
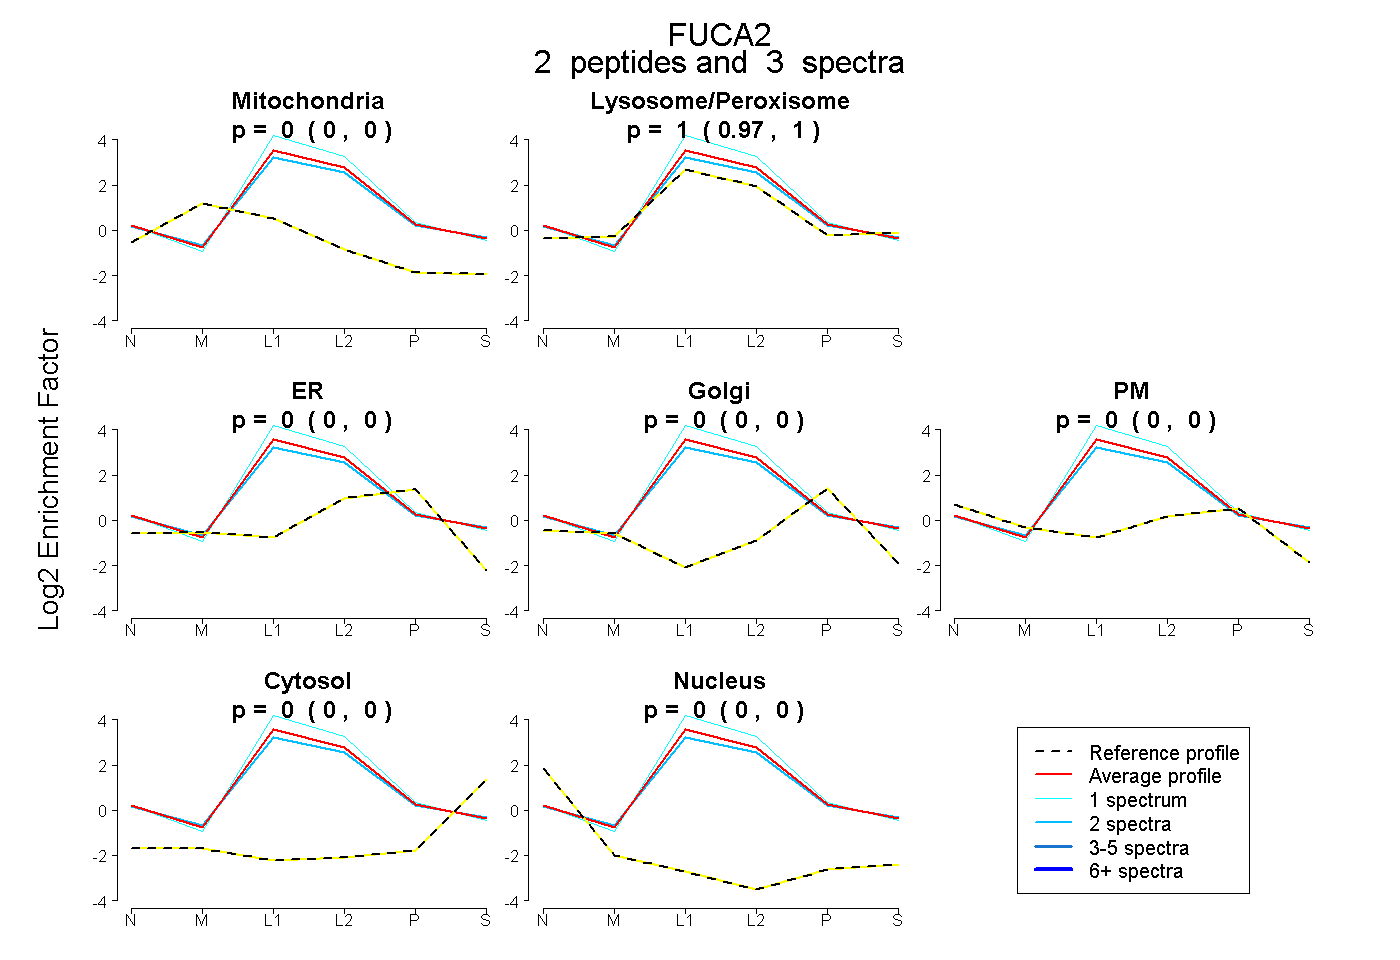 |
0.000 0.000 | 0.000 |
1.000 0.970 | 1.000 |
0.000 0.000 | 0.000 |
0.000 0.000 | 0.000 |
0.000 0.000 | 0.000 |
0.000 0.000 | 0.000 |
0.000 0.000 | 0.000 |
|||
| Plot | Lyso | Other | |||||||||||
| Expt C |
16 peptides |
76 spectra |
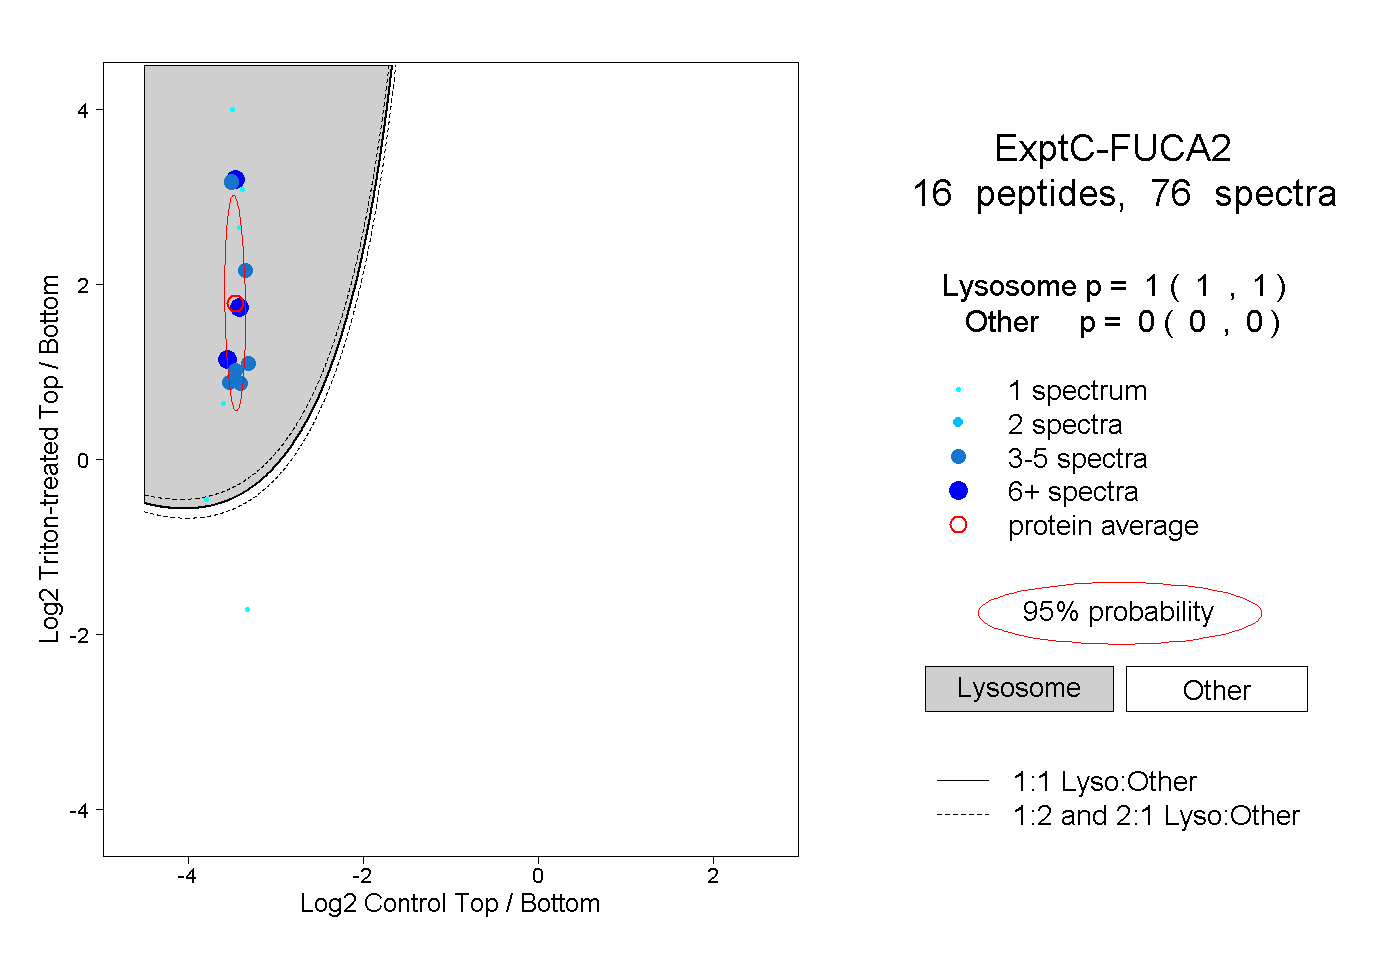 |
1.000 1.000 | 1.000 |
0.000 0.000 | 0.000 |
||||||||
| Plot | Lyso | Other | |||||||||||
| Expt D |
2 peptides |
3 spectra |
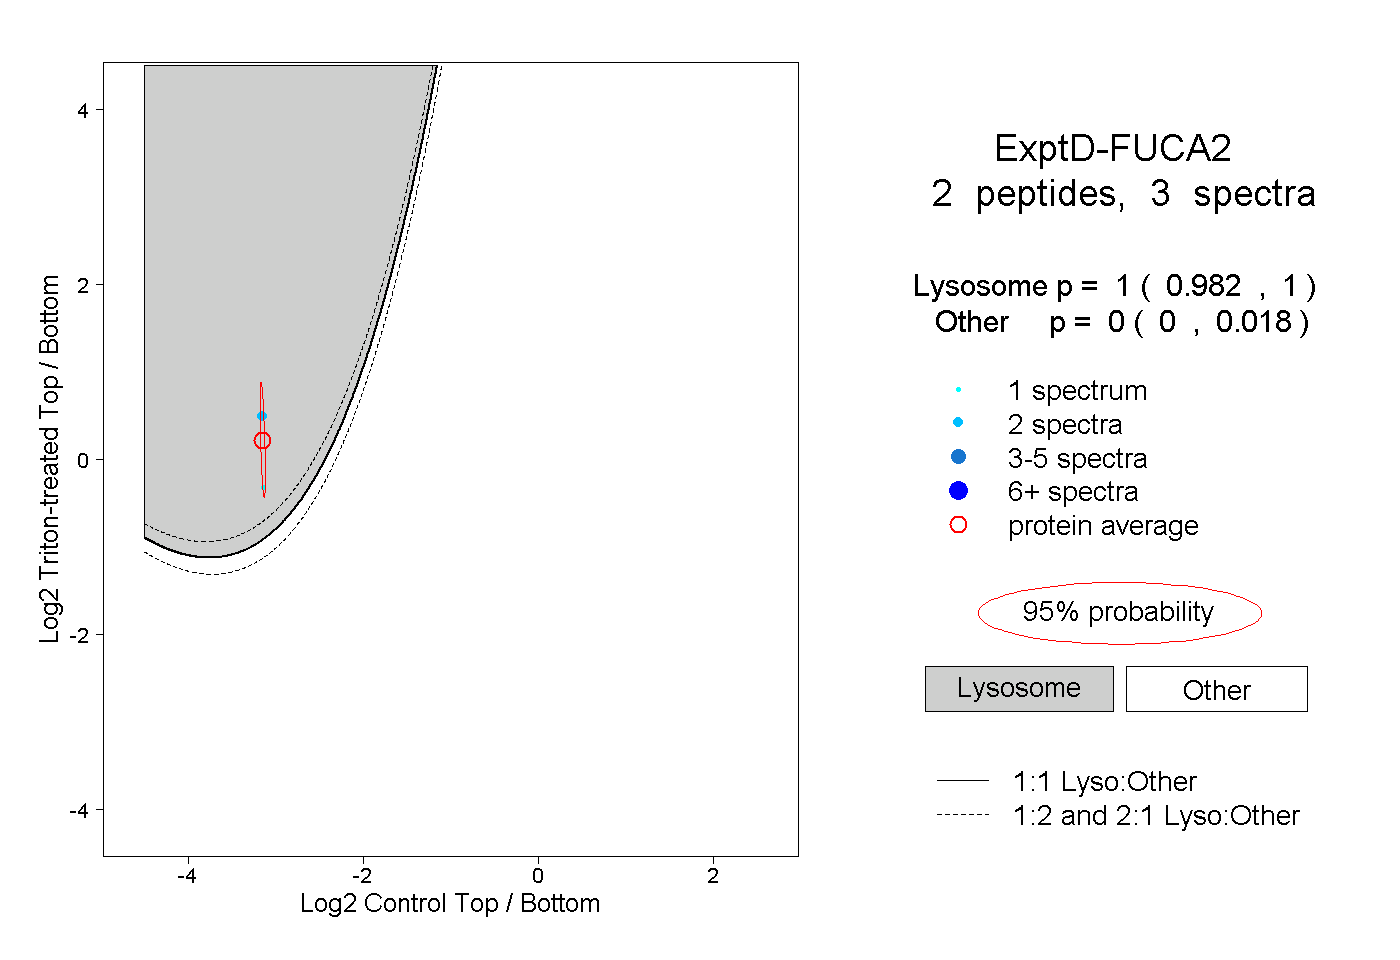 |
1.000 0.982 | 1.000 |
0.000 0.000 | 0.018 |