 4
4peptides
spectra
0.000 | 0.000
0.906 | 0.954
0.000 | 0.024
0.000 | 0.000
0.000 | 0.000
0.018 | 0.089
0.000 | 0.000
0.000 | 0.000
9peptides
spectra
0.025 | 0.986
0.013 | 0.975
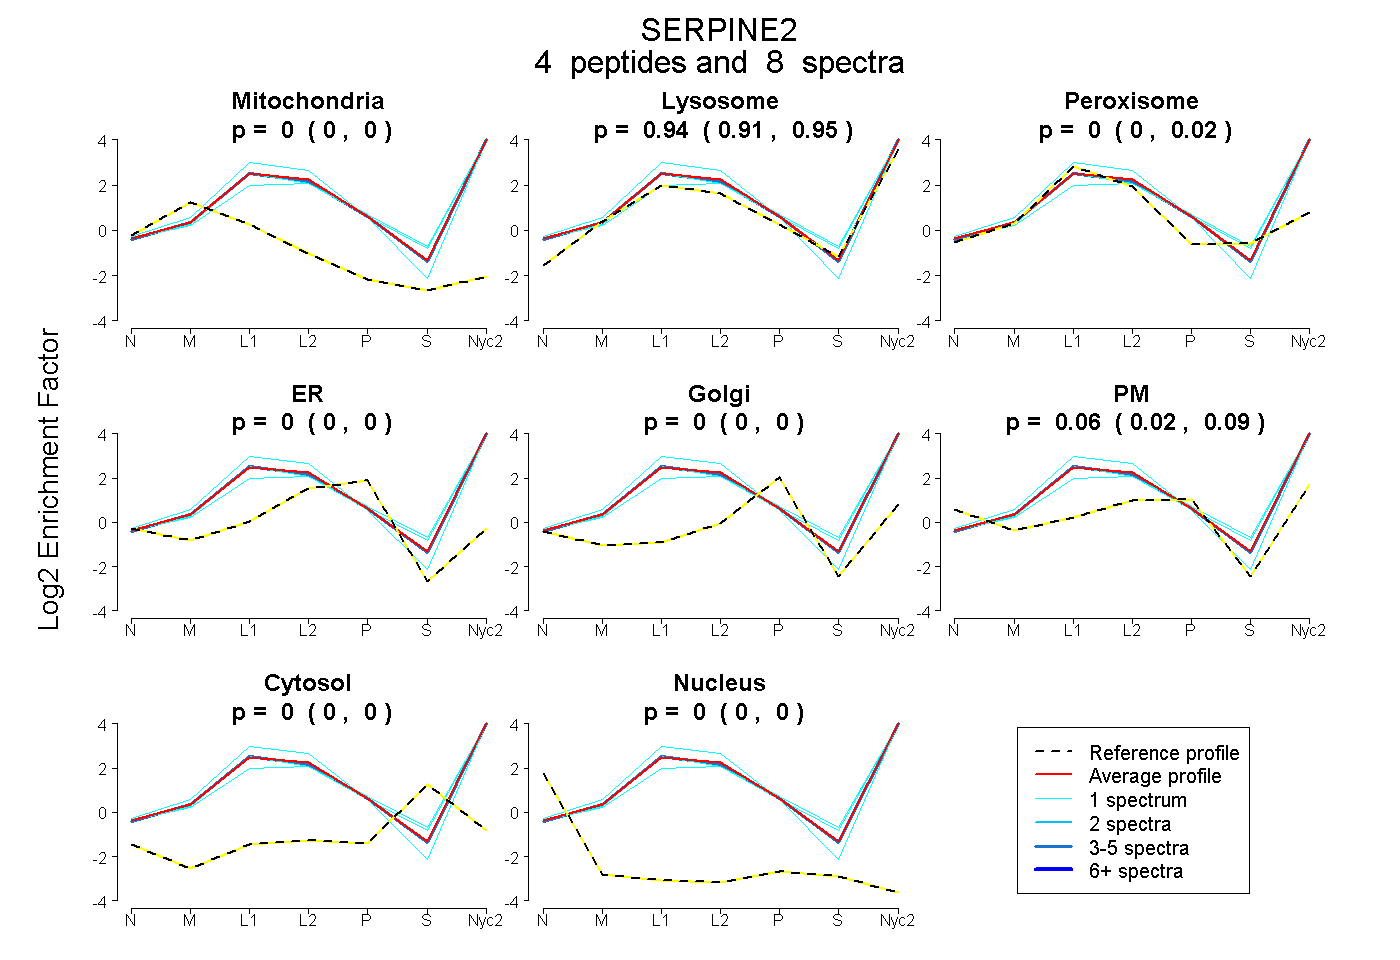
| Plot | Mito | Lyso | Perox | ER | Golgi | PM | Cytosol | Nucleus | |||||
| Expt A |
4 peptides |
8 spectra |
|
0.000 0.000 | 0.000 |
0.939 0.906 | 0.954 |
0.000 0.000 | 0.024 |
0.000 0.000 | 0.000 |
0.000 0.000 | 0.000 |
0.061 0.018 | 0.089 |
0.000 0.000 | 0.000 |
0.000 0.000 | 0.000 |
||
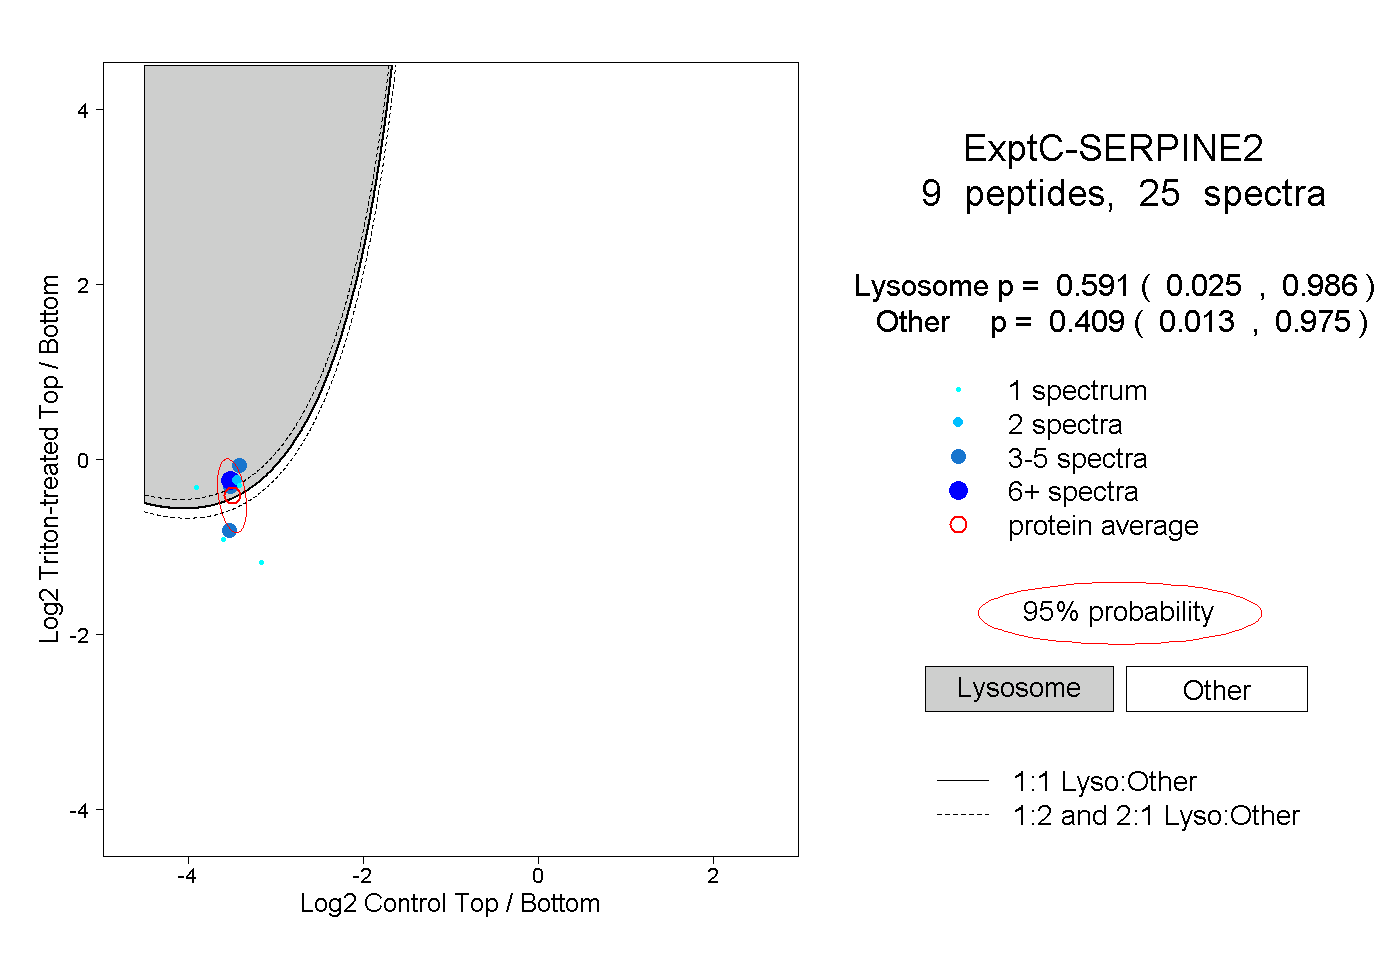
| Plot | Lyso | Other | |||||||||||
| Expt C |
9 peptides |
25 spectra |
|
0.591 0.025 | 0.986 |
0.409 0.013 | 0.975 |
| 2 spectra, VEVPFAAR | 0.879 | 0.121 | ||||||||
| 1 spectrum, AAVVTTAILIAR | 0.000 | 1.000 | ||||||||
| 1 spectrum, YNVNGVGK | 0.776 | 0.224 | ||||||||
| 5 spectra, MQLVLPK | 0.841 | 0.159 | ||||||||
| 3 spectra, IEVSEDGTK | 0.973 | 0.027 | ||||||||
| 1 spectrum, ALGITEMFEPSK | 0.953 | 0.047 | ||||||||
| 6 spectra, TFVAGDGK | 0.923 | 0.077 | ||||||||
| 1 spectrum, AIVSK | 0.007 | 0.993 | ||||||||
| 5 spectra, QLSTVMR | 0.018 | 0.982 |