 4
4peptides
spectra
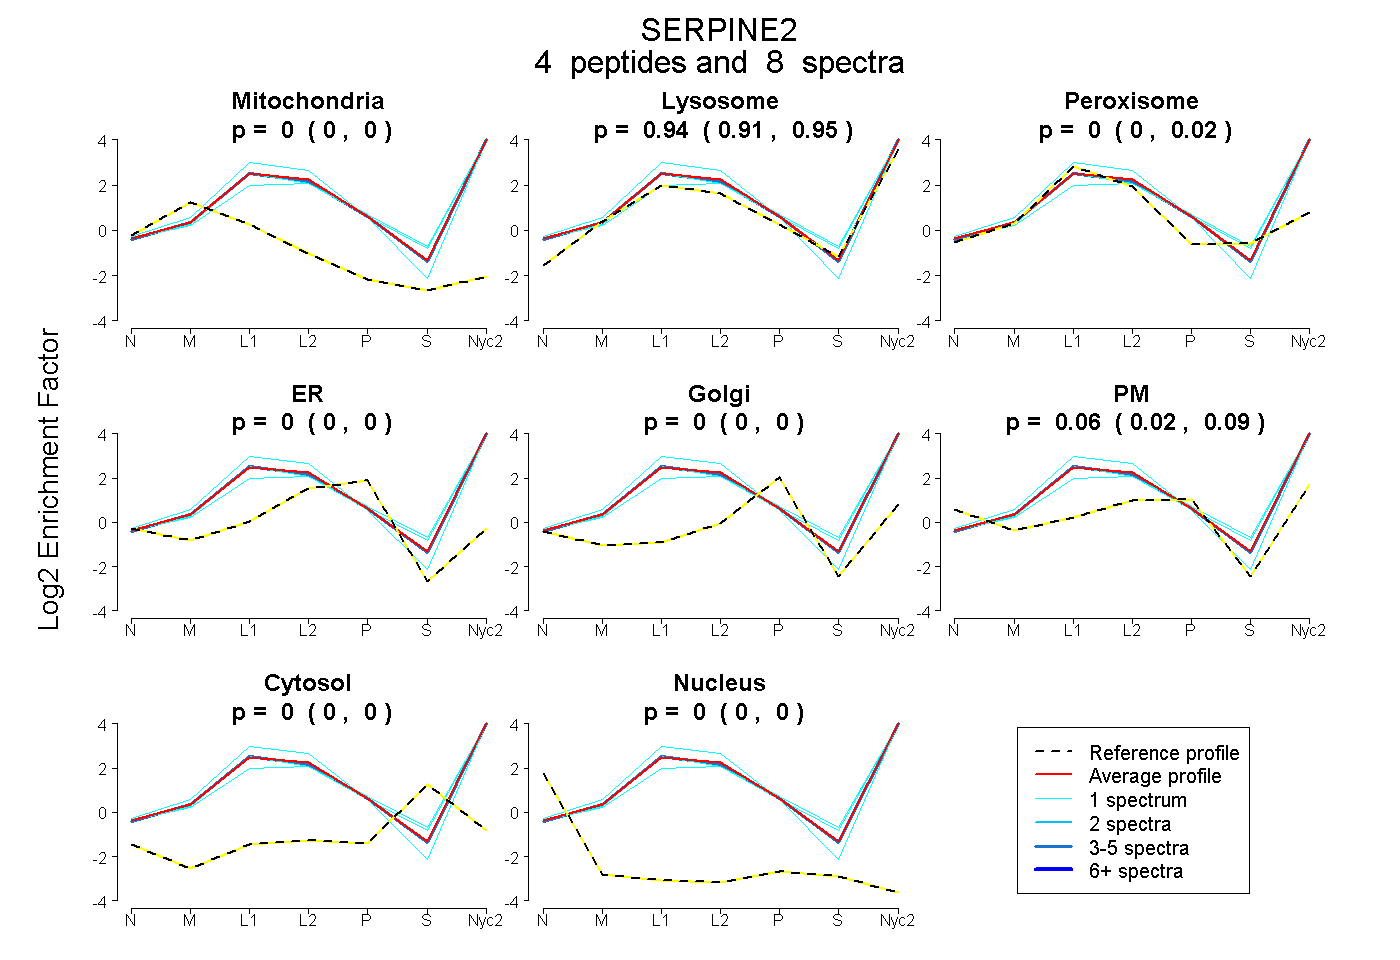
0.000 | 0.000
0.906 | 0.954
0.000 | 0.024
0.000 | 0.000
0.000 | 0.000
0.018 | 0.089
0.000 | 0.000
0.000 | 0.000
| Plot | Mito | Lyso | Perox | ER | Golgi | PM | Cytosol | Nucleus | |||||
| Expt A |
4 peptides |
8 spectra |
|
0.000 0.000 | 0.000 |
0.939 0.906 | 0.954 |
0.000 0.000 | 0.024 |
0.000 0.000 | 0.000 |
0.000 0.000 | 0.000 |
0.061 0.018 | 0.089 |
0.000 0.000 | 0.000 |
0.000 0.000 | 0.000 |
| 1 spectrum, DIVTVANAVFVR | 0.000 | 0.932 | 0.014 | 0.000 | 0.000 | 0.054 | 0.000 | 0.000 | ||
| 1 spectrum, QLSTVMR | 0.000 | 0.912 | 0.000 | 0.000 | 0.000 | 0.088 | 0.000 | 0.000 | ||
| 5 spectra, AAVVTTAILIAR | 0.000 | 0.940 | 0.000 | 0.000 | 0.000 | 0.060 | 0.000 | 0.000 | ||
| 1 spectrum, ALGITEMFEPSK | 0.000 | 0.939 | 0.040 | 0.000 | 0.000 | 0.020 | 0.000 | 0.000 |
| Plot | Lyso | Other | |||||||||||
| Expt C |
9 peptides |
25 spectra |
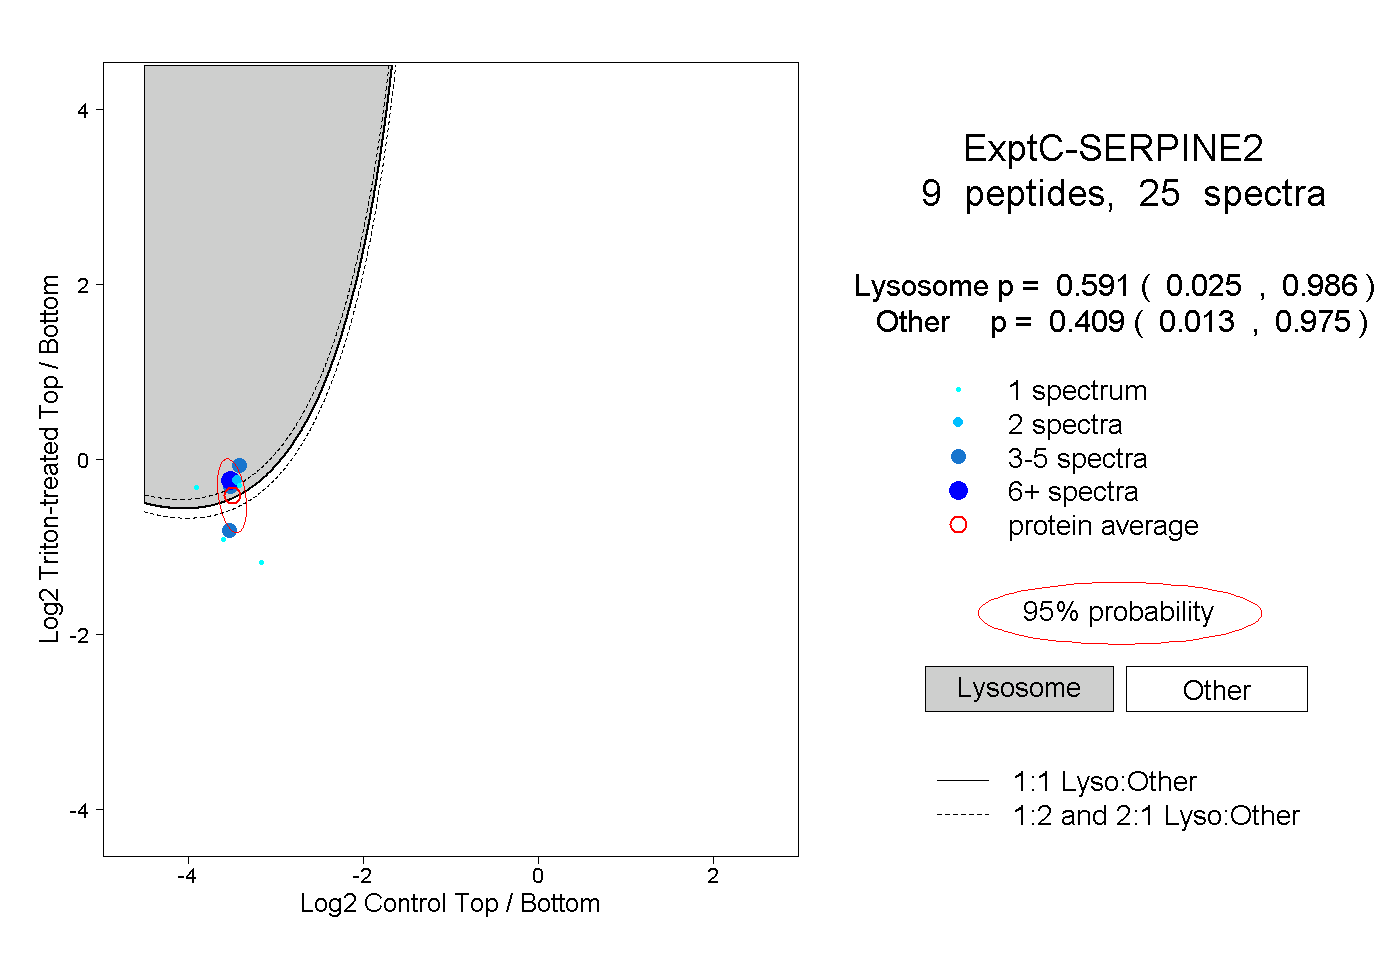 |
0.591 0.025 | 0.986 |
0.409 0.013 | 0.975 |