 8
8peptides
spectra
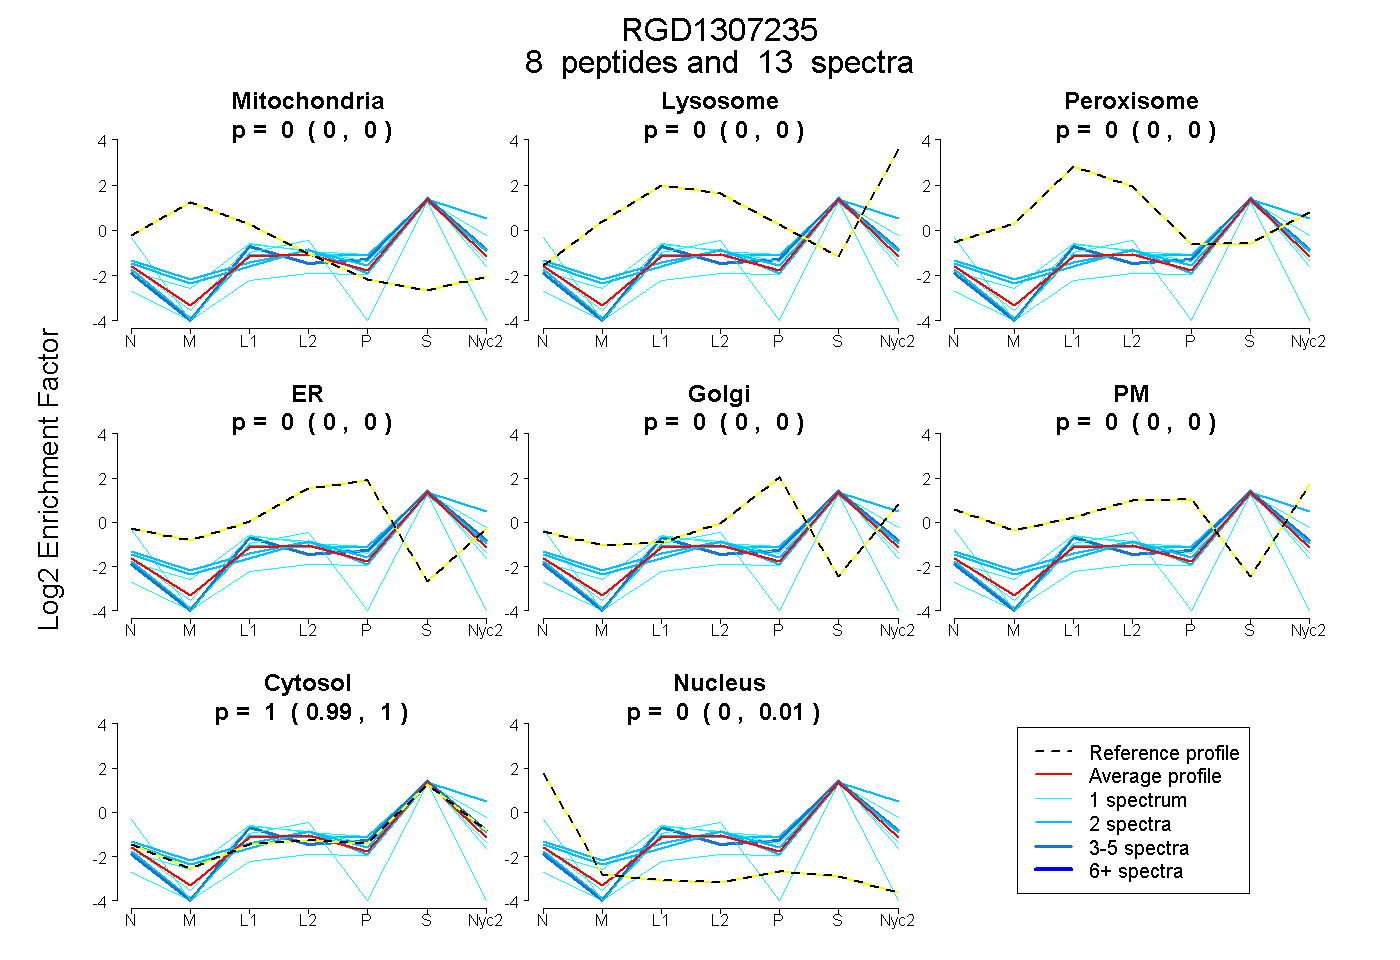
0.000 | 0.000
0.000 | 0.000
0.000 | 0.000
0.000 | 0.000
0.000 | 0.000
0.000 | 0.000
0.989 | 1.000
0.000 | 0.008
| Plot | Mito | Lyso | Perox | ER | Golgi | PM | Cytosol | Nucleus | |||||
| Expt A |
8 peptides |
13 spectra |
|
0.000 0.000 | 0.000 |
0.000 0.000 | 0.000 |
0.000 0.000 | 0.000 |
0.000 0.000 | 0.000 |
0.000 0.000 | 0.000 |
0.000 0.000 | 0.000 |
1.000 0.989 | 1.000 |
0.000 0.000 | 0.008 |
| 1 spectrum, DGEHGLDEHK | 0.000 | 0.000 | 0.000 | 0.000 | 0.000 | 0.000 | 0.986 | 0.014 | ||
| 1 spectrum, LSIDAIAAQLLR | 0.000 | 0.000 | 0.019 | 0.000 | 0.000 | 0.000 | 0.981 | 0.000 | ||
| 2 spectra, RPDDEQR | 0.022 | 0.000 | 0.038 | 0.000 | 0.000 | 0.000 | 0.940 | 0.000 | ||
| 3 spectra, EPSTTSGGGQLNR | 0.000 | 0.000 | 0.000 | 0.000 | 0.000 | 0.000 | 1.000 | 0.000 | ||
| 2 spectra, VKPQFQEILR | 0.024 | 0.000 | 0.000 | 0.000 | 0.000 | 0.000 | 0.976 | 0.000 | ||
| 2 spectra, DYFSNPGNFER | 0.000 | 0.069 | 0.000 | 0.000 | 0.000 | 0.000 | 0.931 | 0.000 | ||
| 1 spectrum, DQYLLTALELHTELLESGR | 0.000 | 0.121 | 0.000 | 0.000 | 0.000 | 0.000 | 0.879 | 0.000 | ||
| 1 spectrum, LHGEVPHIEVTR | 0.000 | 0.000 | 0.000 | 0.000 | 0.000 | 0.000 | 0.685 | 0.315 |
| Plot | Mito | Lyso or Perox | ER | Golgi | PM | Cytosol | Nucleus | ||||||
| Expt B |
2 peptides |
2 spectra |
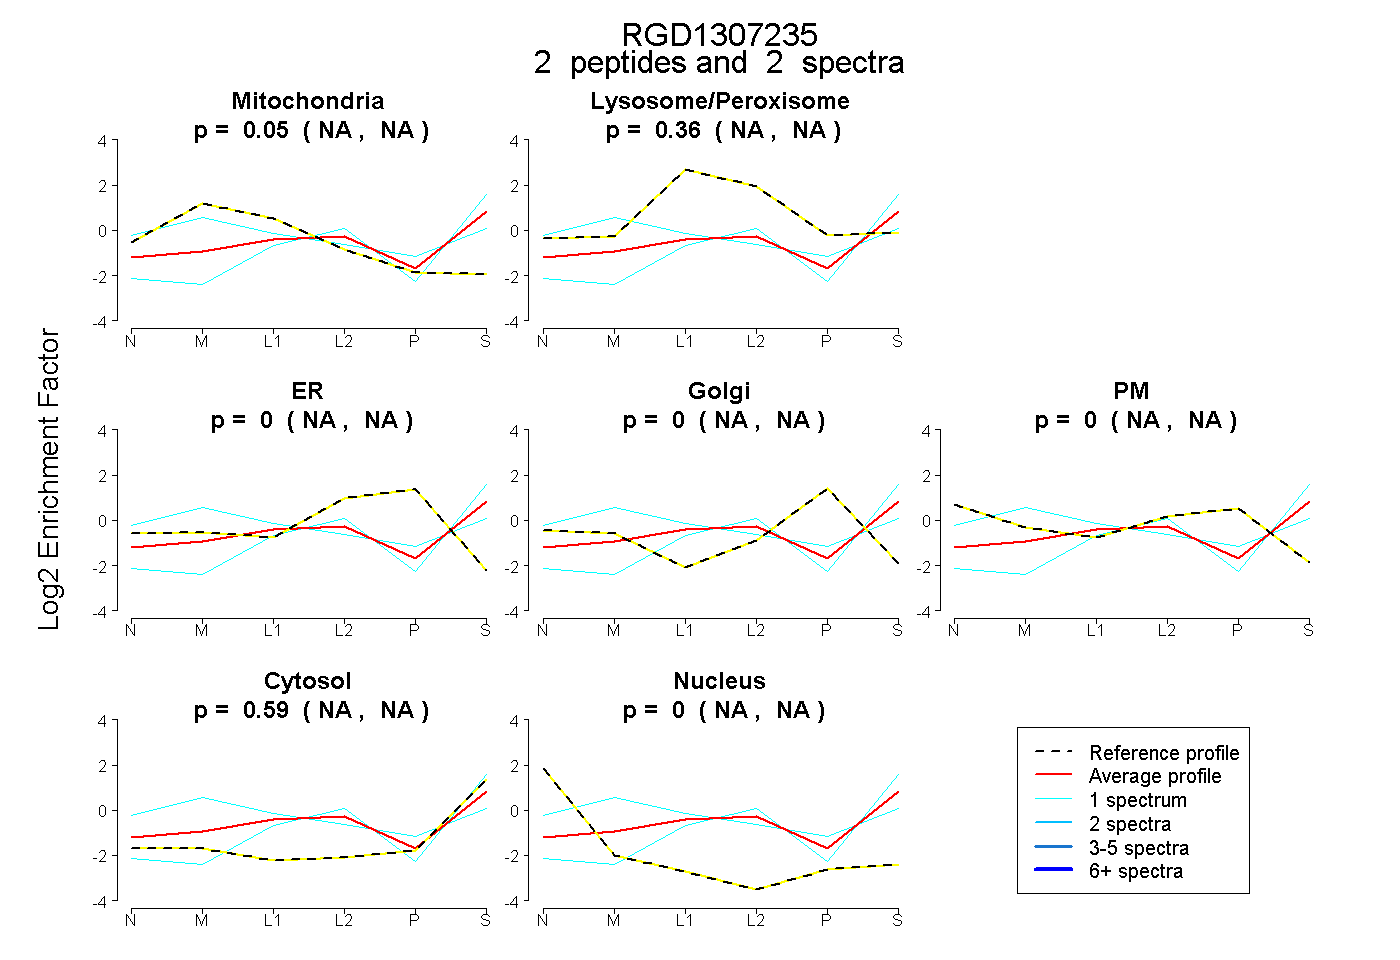 |
0.047 NA | NA |
0.360 NA | NA |
0.000 NA | NA |
0.000 NA | NA |
0.000 NA | NA |
0.592 NA | NA |
0.000 NA | NA |
|||
| Plot | Lyso | Other | |||||||||||
| Expt C |
4 peptides |
13 spectra |
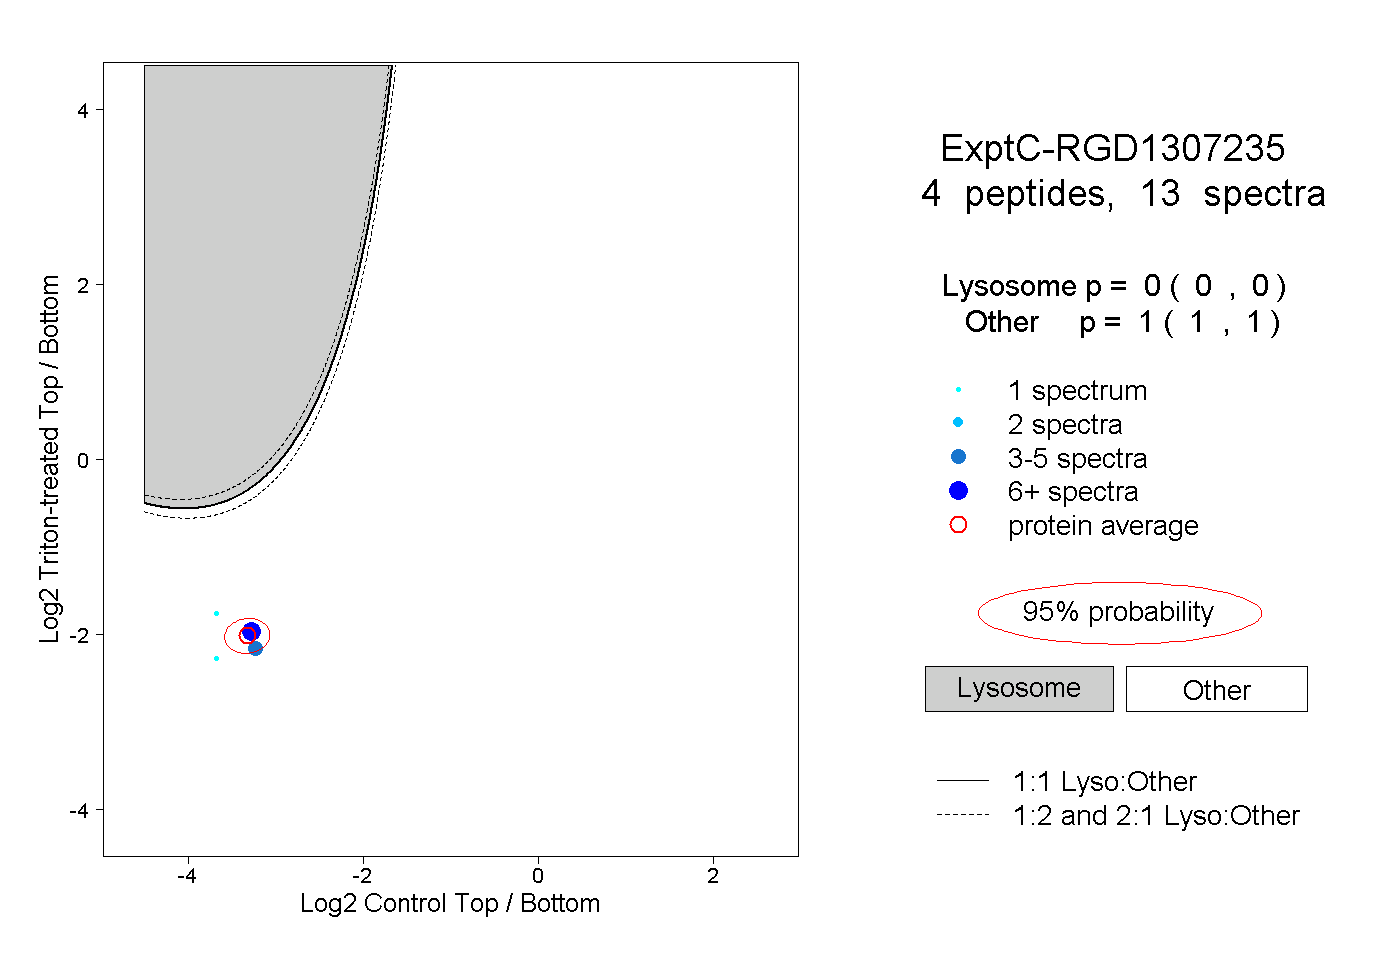 |
0.000 0.000 | 0.000 |
1.000 1.000 | 1.000 |