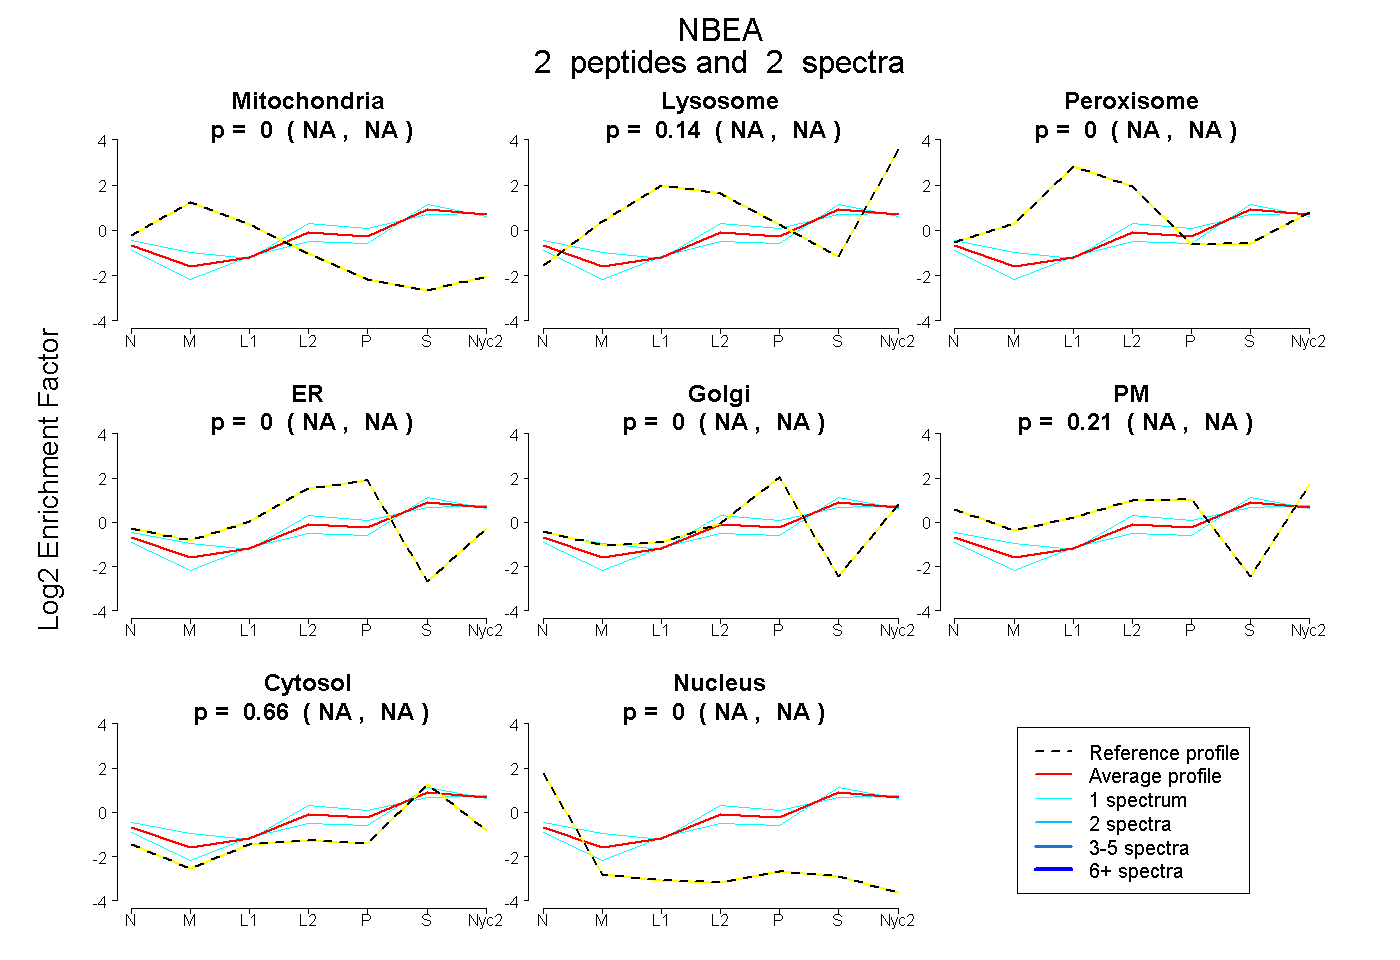
 2
2peptides
spectra
NA | NA
NA | NA
NA | NA
NA | NA
NA | NA
NA | NA
NA | NA
NA | NA
| Plot | Mito | Lyso | Perox | ER | Golgi | PM | Cytosol | Nucleus | |||||
| Expt A |
2 peptides |
2 spectra |
|
0.000 NA | NA |
0.136 NA | NA |
0.000 NA | NA |
0.000 NA | NA |
0.000 NA | NA |
0.207 NA | NA |
0.657 NA | NA |
0.000 NA | NA |
| 1 spectrum, VAPLLR | 0.000 | 0.150 | 0.000 | 0.000 | 0.000 | 0.088 | 0.762 | 0.000 | ||
| 1 spectrum, GPEAVR | 0.000 | 0.121 | 0.000 | 0.000 | 0.000 | 0.326 | 0.553 | 0.000 |
| Plot | Lyso | Other | |||||||||||
| Expt C |
2 peptides |
3 spectra |
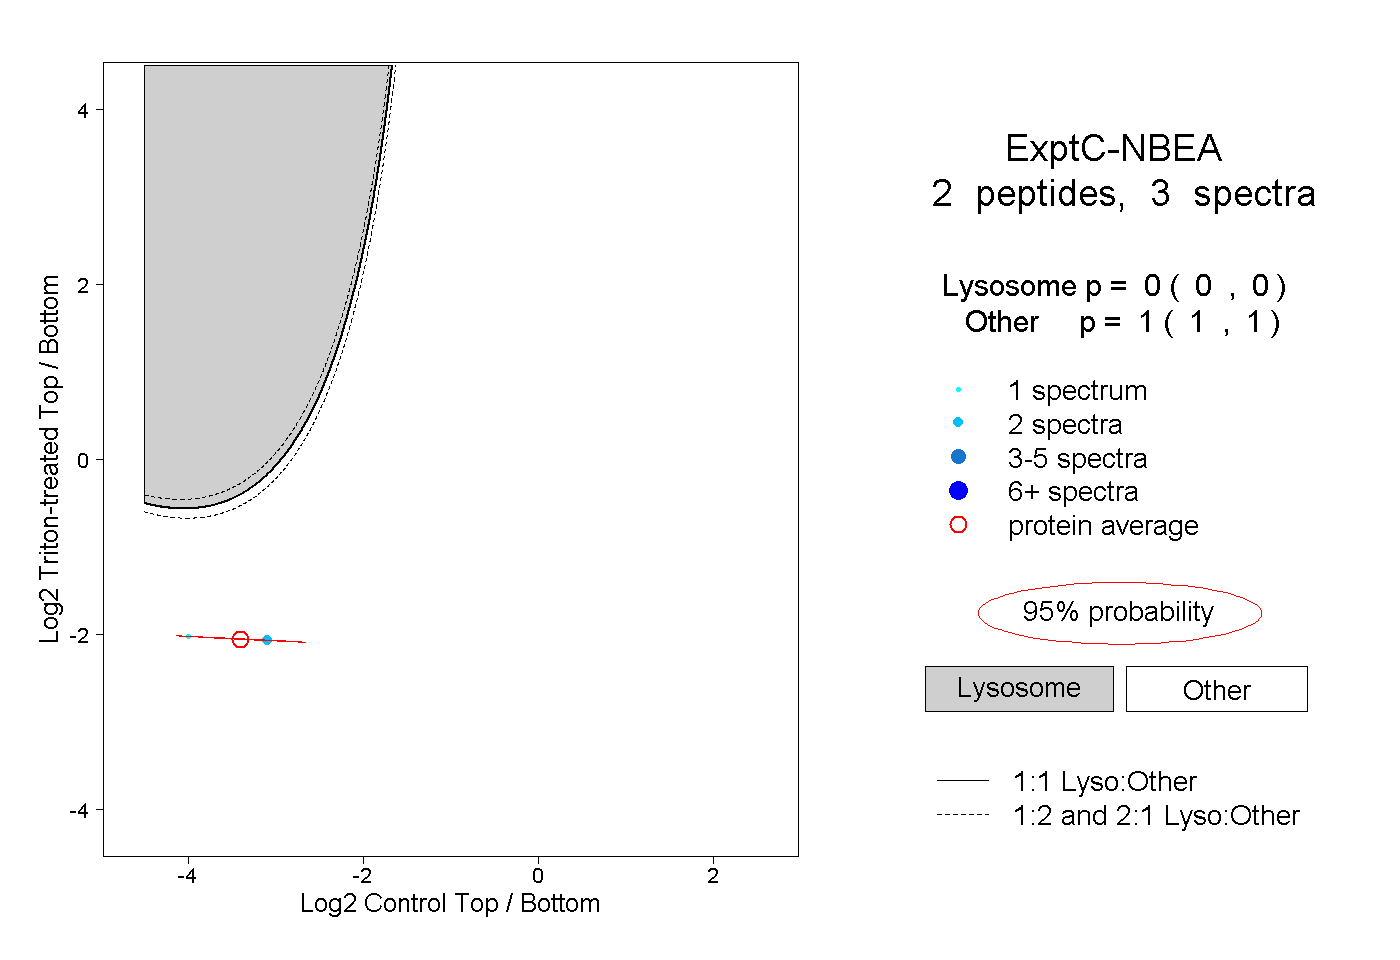 |
0.000 0.000 | 0.000 |
1.000 1.000 | 1.000 |