 7
7peptides
spectra
0.256 | 0.290
0.006 | 0.071
0.308 | 0.393
0.220 | 0.307
0.000 | 0.000
0.014 | 0.103
0.000 | 0.000
0.000 | 0.000
| Plot | Mito | Lyso | Perox | ER | Golgi | PM | Cytosol | Nucleus | |||||
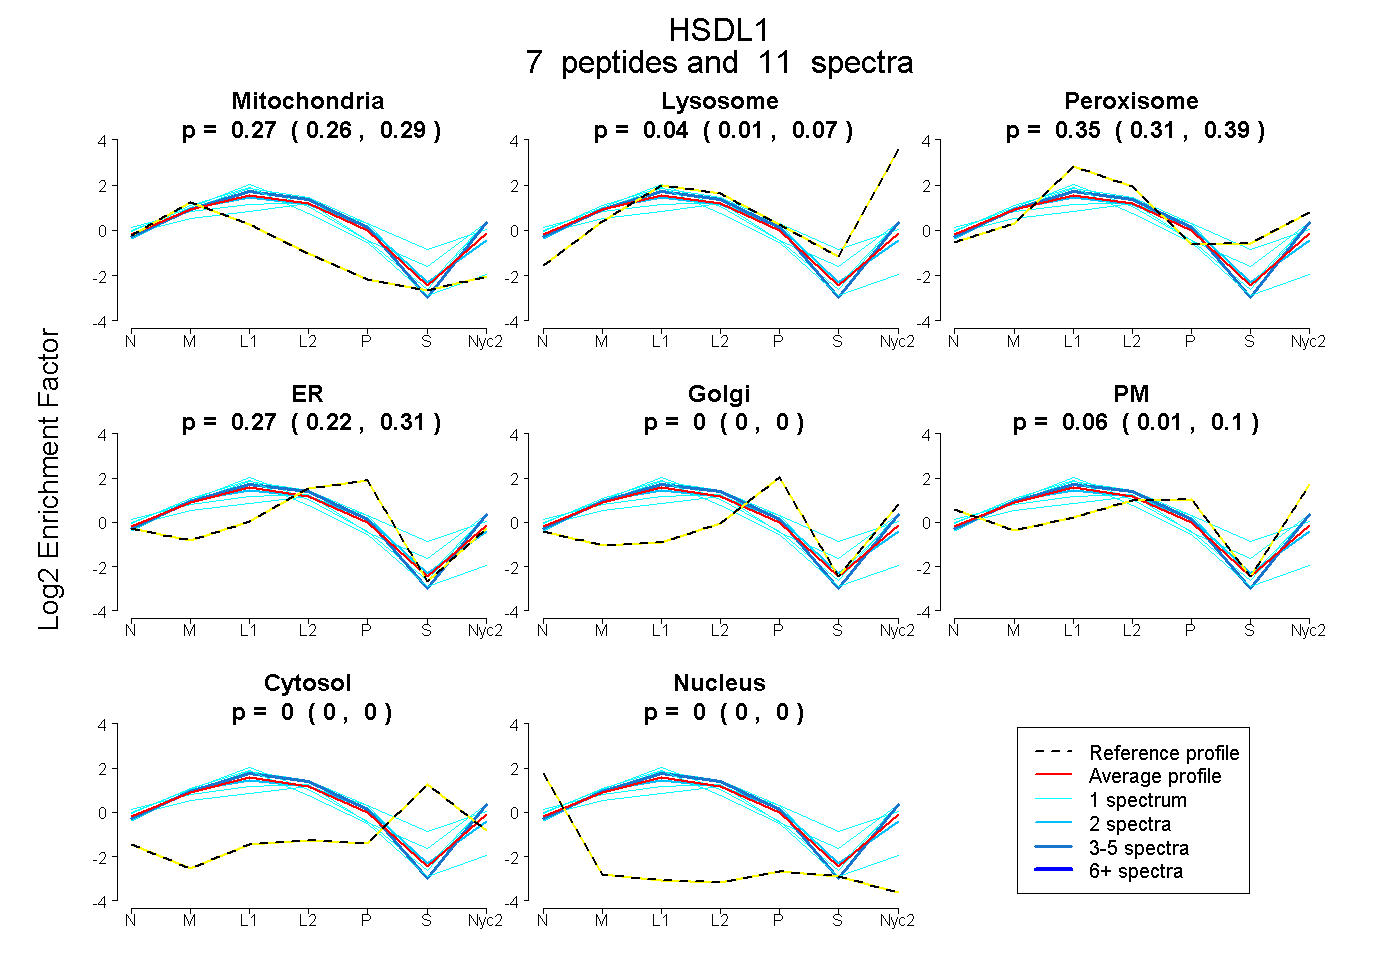
| Expt A |
7 peptides |
11 spectra |
|
0.274 0.256 | 0.290 |
0.041 0.006 | 0.071 |
0.355 0.308 | 0.393 |
0.267 0.220 | 0.307 |
0.000 0.000 | 0.000 |
0.063 0.014 | 0.103 |
0.000 0.000 | 0.000 |
0.000 0.000 | 0.000 |
| 1 spectrum, HIADTYR | 0.121 | 0.000 | 0.456 | 0.221 | 0.059 | 0.076 | 0.068 | 0.000 | ||
| 2 spectra, CPWLAPSPR | 0.281 | 0.016 | 0.352 | 0.351 | 0.000 | 0.000 | 0.000 | 0.000 | ||
| 1 spectrum, SIPVICDFYSLVR | 0.541 | 0.000 | 0.247 | 0.212 | 0.000 | 0.000 | 0.000 | 0.000 | ||
| 1 spectrum, AAVDSFYLLYR | 0.247 | 0.000 | 0.434 | 0.000 | 0.000 | 0.319 | 0.000 | 0.000 | ||
| 4 spectra, LHFIPR | 0.239 | 0.152 | 0.251 | 0.258 | 0.000 | 0.100 | 0.000 | 0.000 | ||
| 1 spectrum, EIYAPIR | 0.189 | 0.168 | 0.333 | 0.306 | 0.000 | 0.005 | 0.000 | 0.000 | ||
| 1 spectrum, ALQYEYASK | 0.287 | 0.053 | 0.405 | 0.000 | 0.000 | 0.255 | 0.000 | 0.000 |
| Plot | Mito | Lyso or Perox | ER | Golgi | PM | Cytosol | Nucleus | ||||||
| Expt B |
2 peptides |
3 spectra |
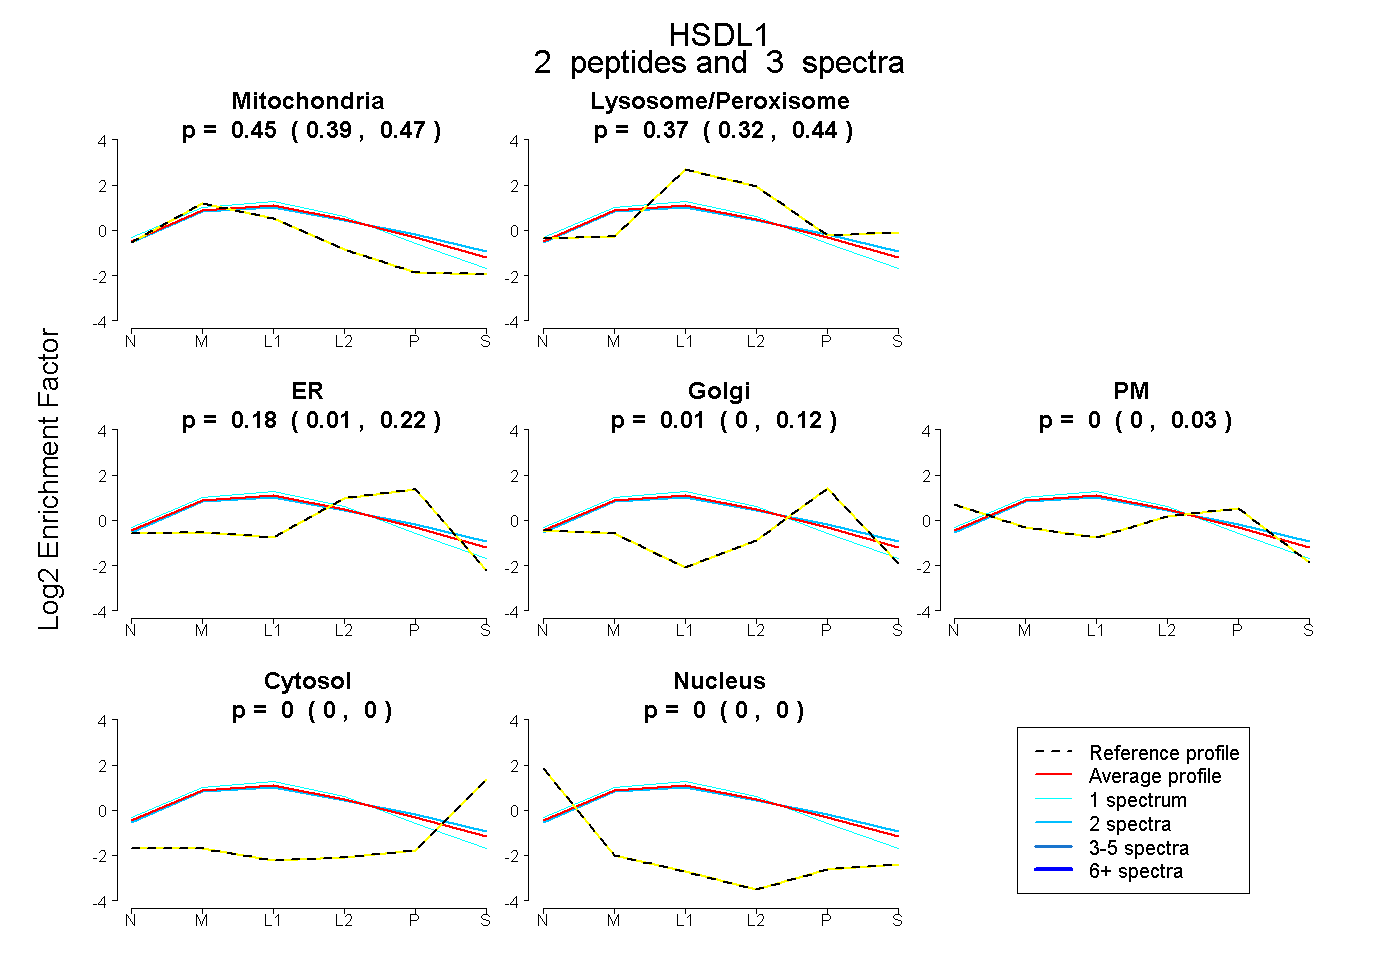 |
0.445 0.387 | 0.473 |
0.366 0.322 | 0.441 |
0.178 0.011 | 0.218 |
0.010 0.000 | 0.123 |
0.000 0.000 | 0.027 |
0.000 0.000 | 0.000 |
0.000 0.000 | 0.000 |
|||
| Plot | Lyso | Other | |||||||||||
| Expt C |
9 peptides |
43 spectra |
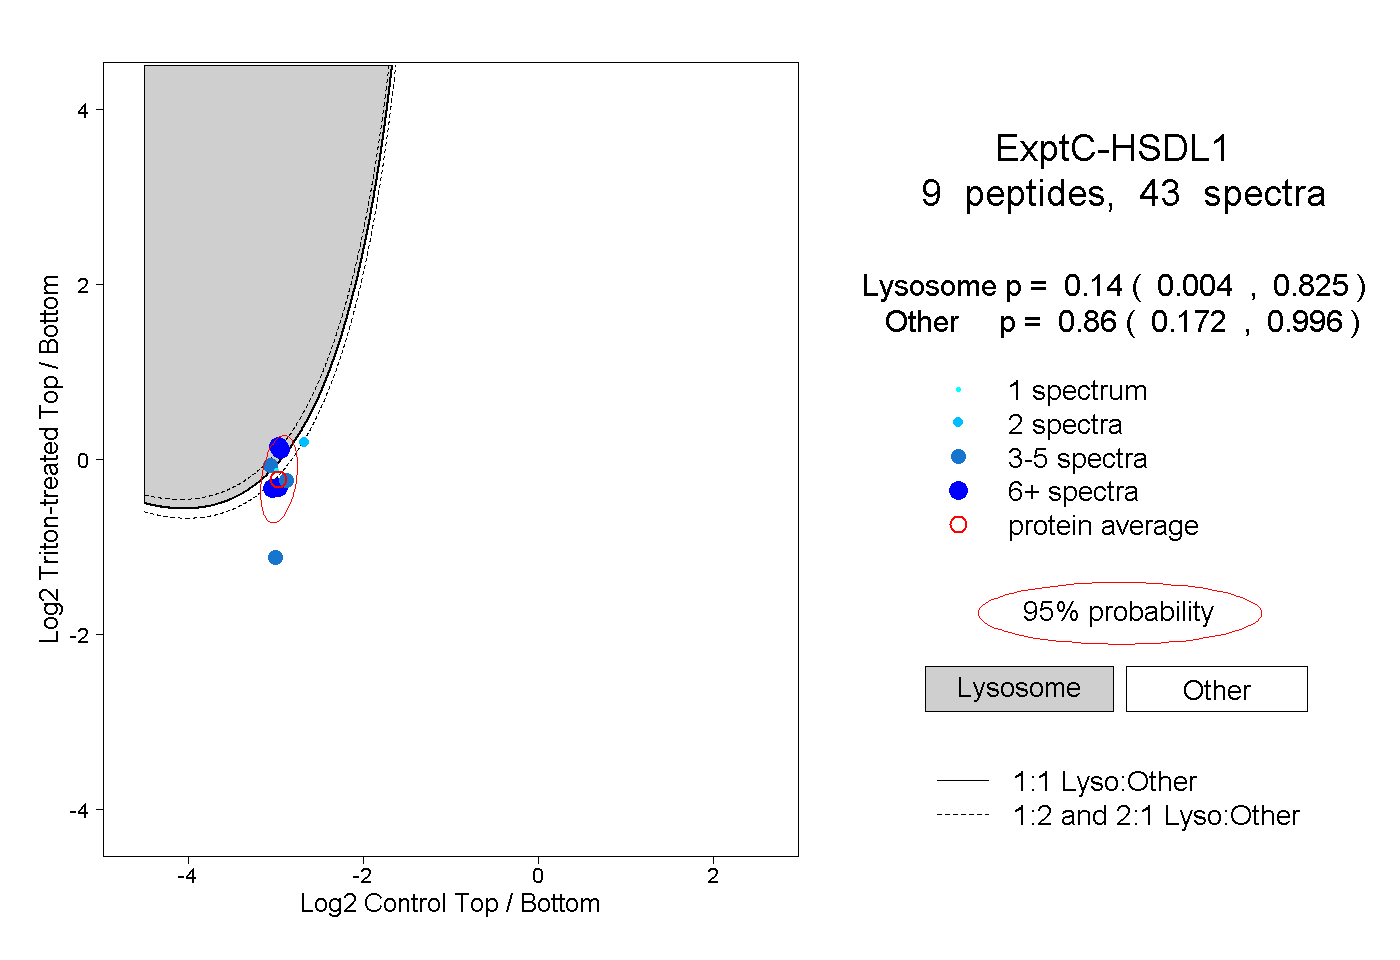 |
0.140 0.004 | 0.825 |
0.860 0.172 | 0.996 |
||||||||
| Plot | Lyso | Other | |||||||||||
| Expt D |
3 peptides |
3 spectra |
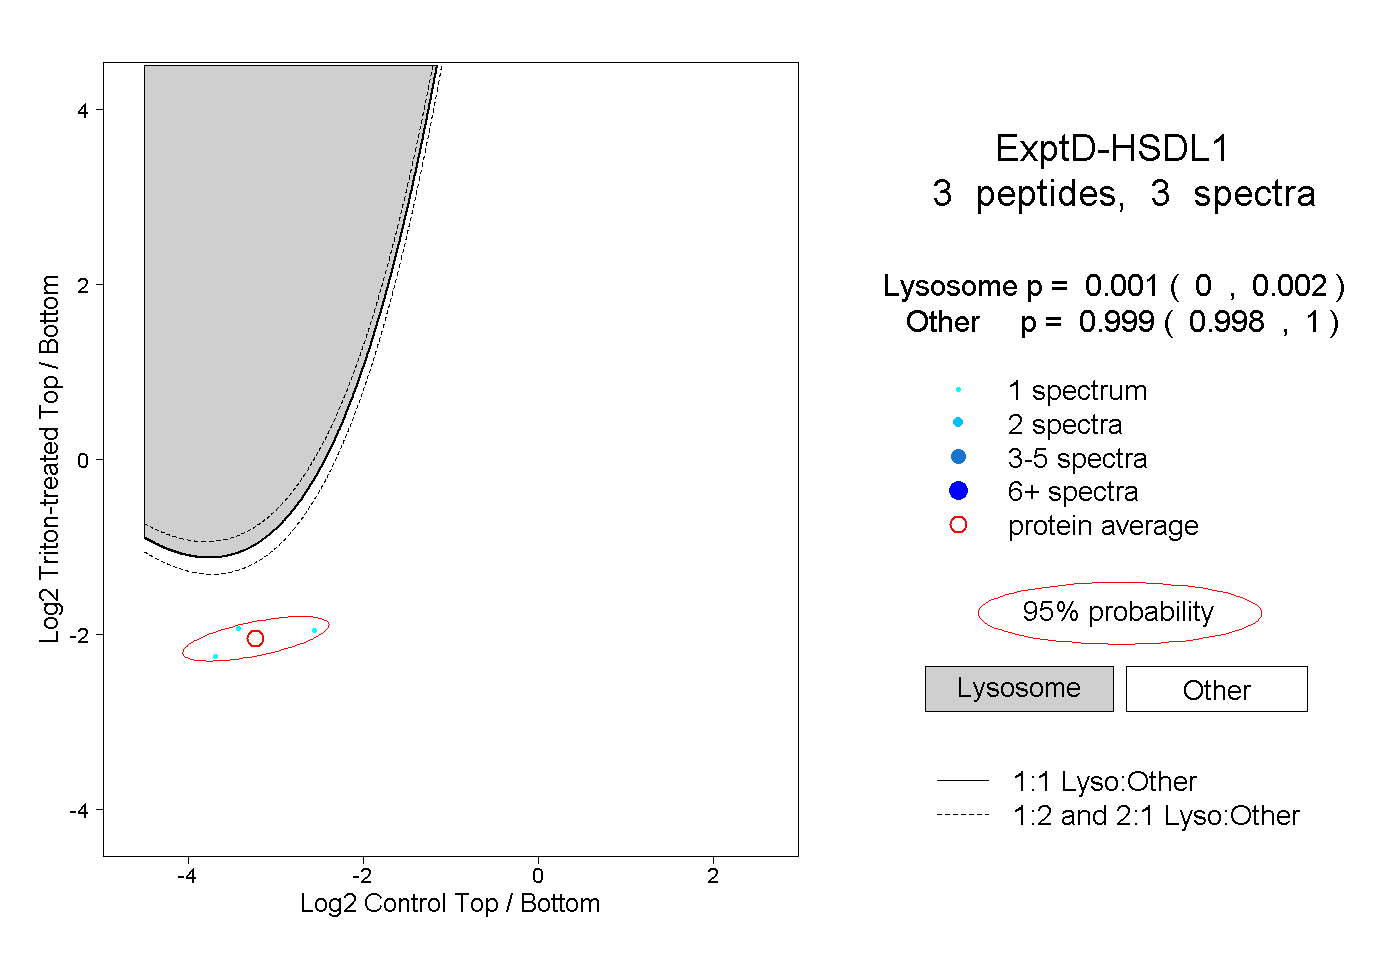 |
0.001 0.000 | 0.002 |
0.999 0.998 | 1.000 |