 4
4peptides
spectra
0.000 | 0.000
0.000 | 0.000
0.000 | 0.113
0.000 | 0.221
0.000 | 0.229
0.146 | 0.373
0.413 | 0.517
0.000 | 0.000
3peptides
spectra
0.000 | 0.000
1.000 | 1.000
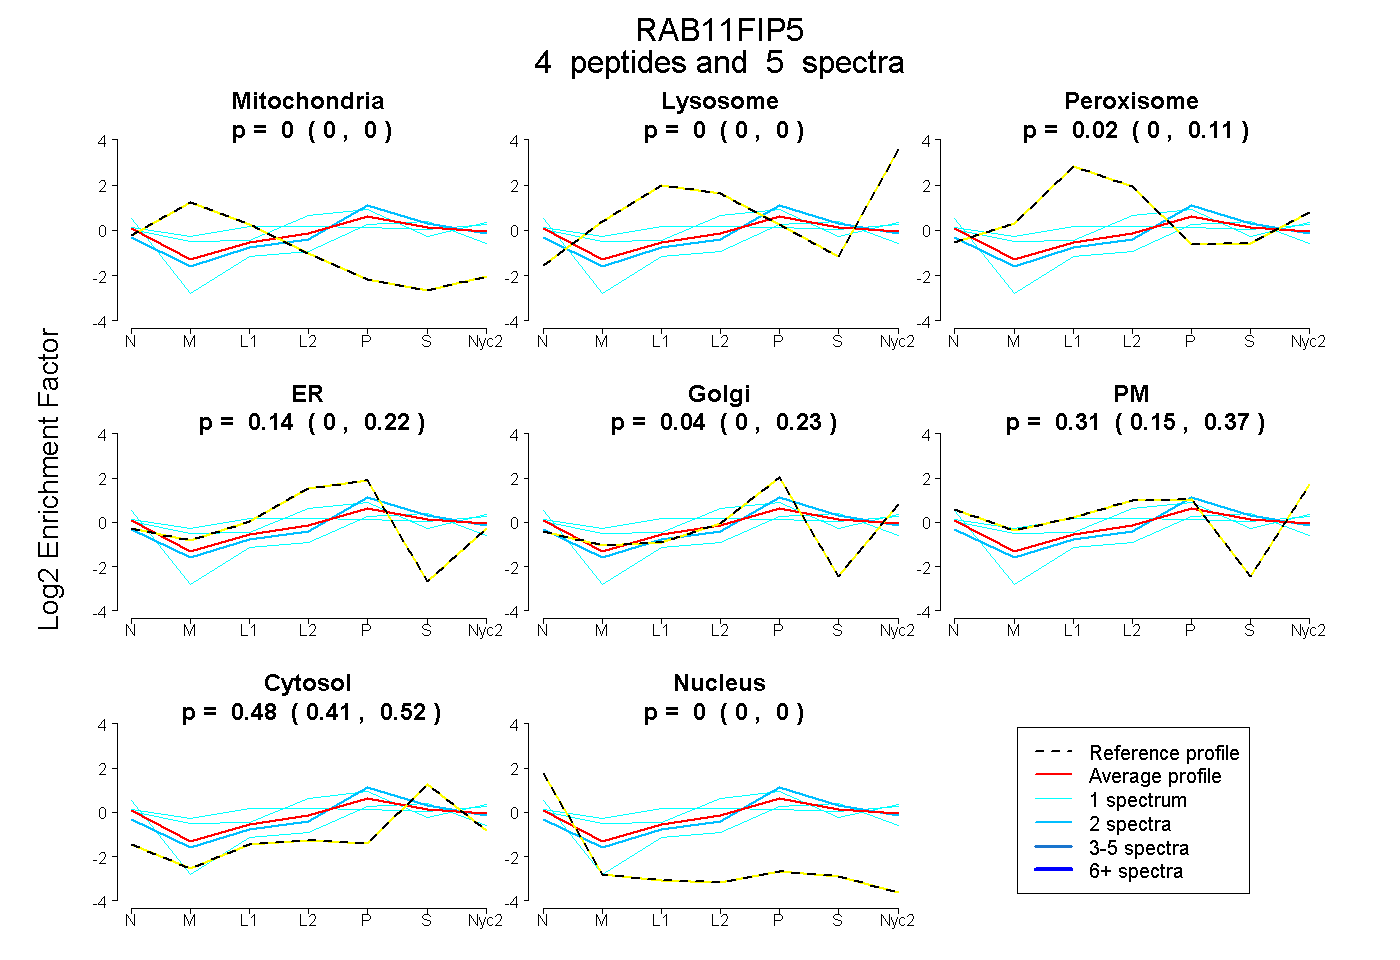
| Plot | Mito | Lyso | Perox | ER | Golgi | PM | Cytosol | Nucleus | |||||
| Expt A |
4 peptides |
5 spectra |
|
0.000 0.000 | 0.000 |
0.000 0.000 | 0.000 |
0.022 0.000 | 0.113 |
0.141 0.000 | 0.221 |
0.041 0.000 | 0.229 |
0.312 0.146 | 0.373 |
0.484 0.413 | 0.517 |
0.000 0.000 | 0.000 |
||
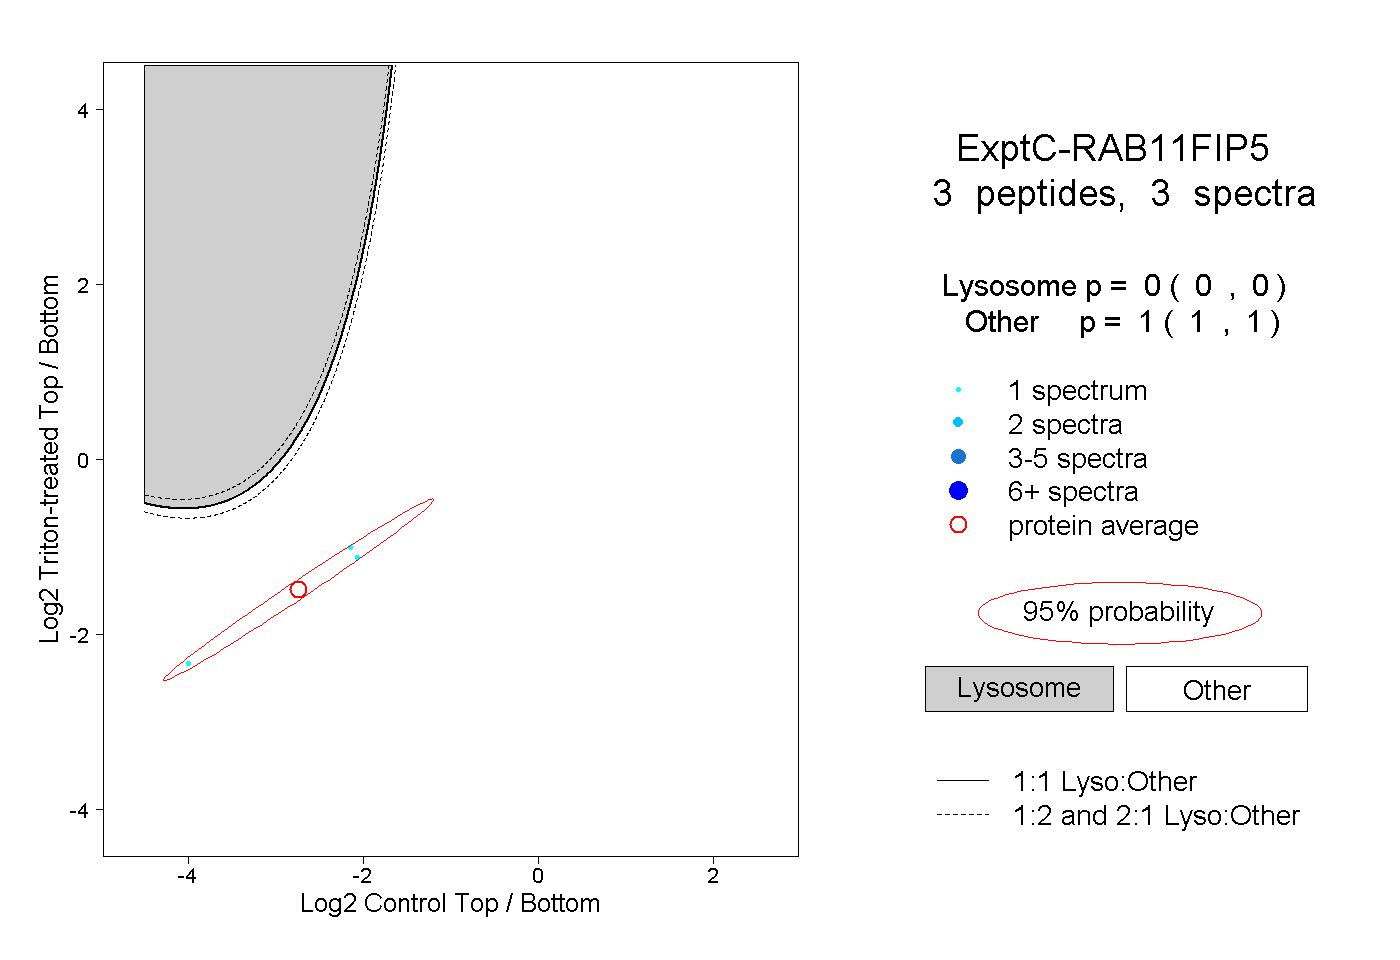
| Plot | Lyso | Other | |||||||||||
| Expt C |
3 peptides |
3 spectra |
|
0.000 0.000 | 0.000 |
1.000 1.000 | 1.000 |