 3
3peptides
spectra
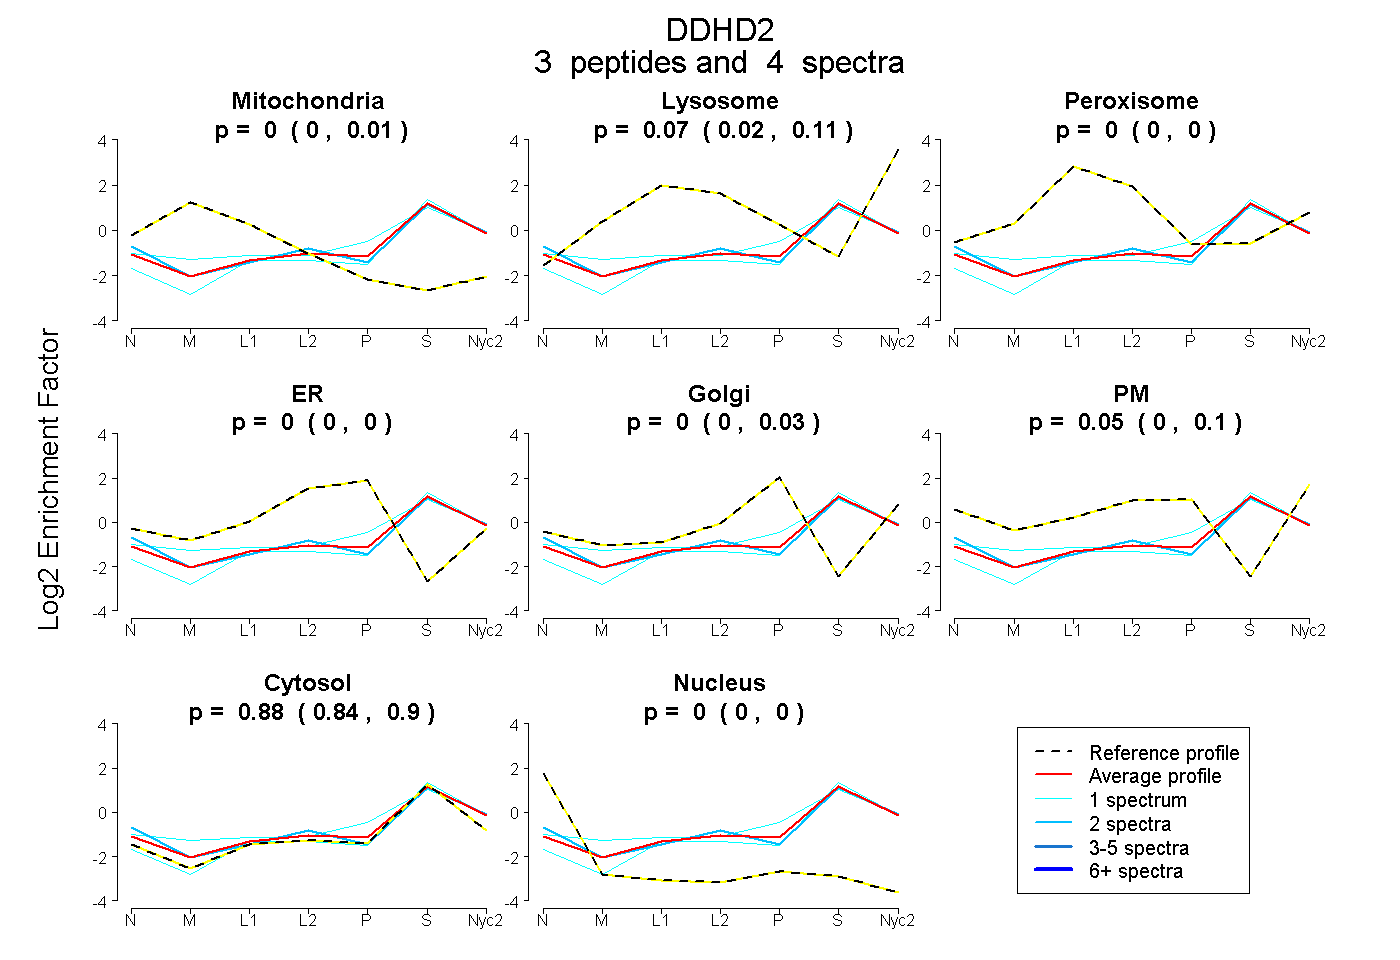
0.000 | 0.009
0.021 | 0.110
0.000 | 0.000
0.000 | 0.000
0.000 | 0.030
0.000 | 0.104
0.841 | 0.902
0.000 | 0.000
2peptides
spectra
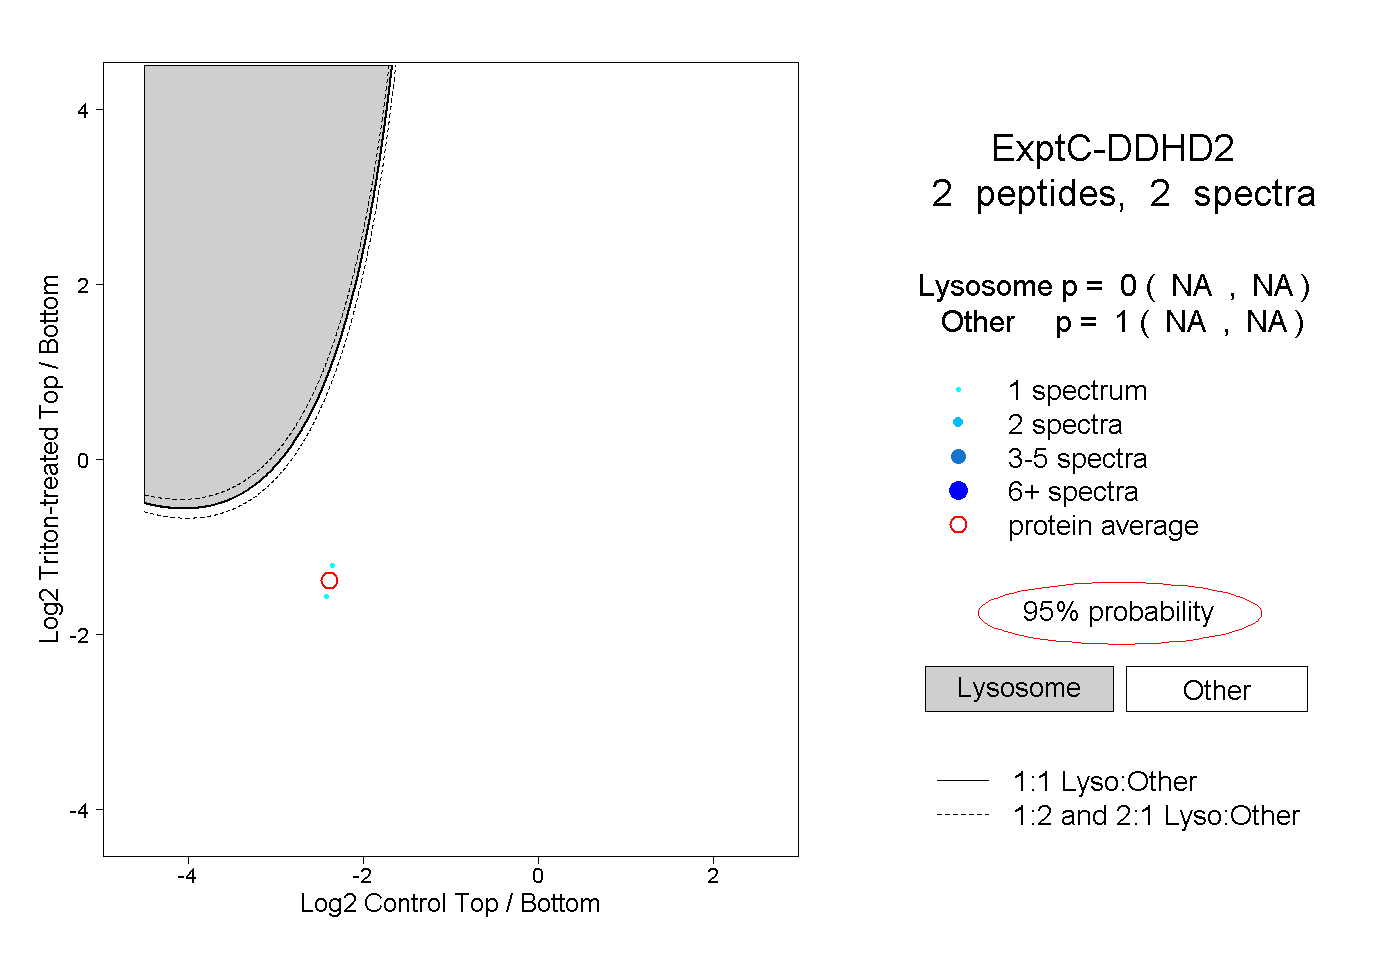
NA | NA
NA | NA
| Plot | Mito | Lyso | Perox | ER | Golgi | PM | Cytosol | Nucleus | |||||
| Expt A |
3 peptides |
4 spectra |
|
0.000 0.000 | 0.009 |
0.073 0.021 | 0.110 |
0.000 0.000 | 0.000 |
0.000 0.000 | 0.000 |
0.000 0.000 | 0.030 |
0.050 0.000 | 0.104 |
0.878 0.841 | 0.902 |
0.000 0.000 | 0.000 |
||
| Plot | Lyso | Other | |||||||||||
| Expt C |
2 peptides |
2 spectra |
|
0.000 NA | NA |
1.000 NA | NA |