 2
2peptides
spectra
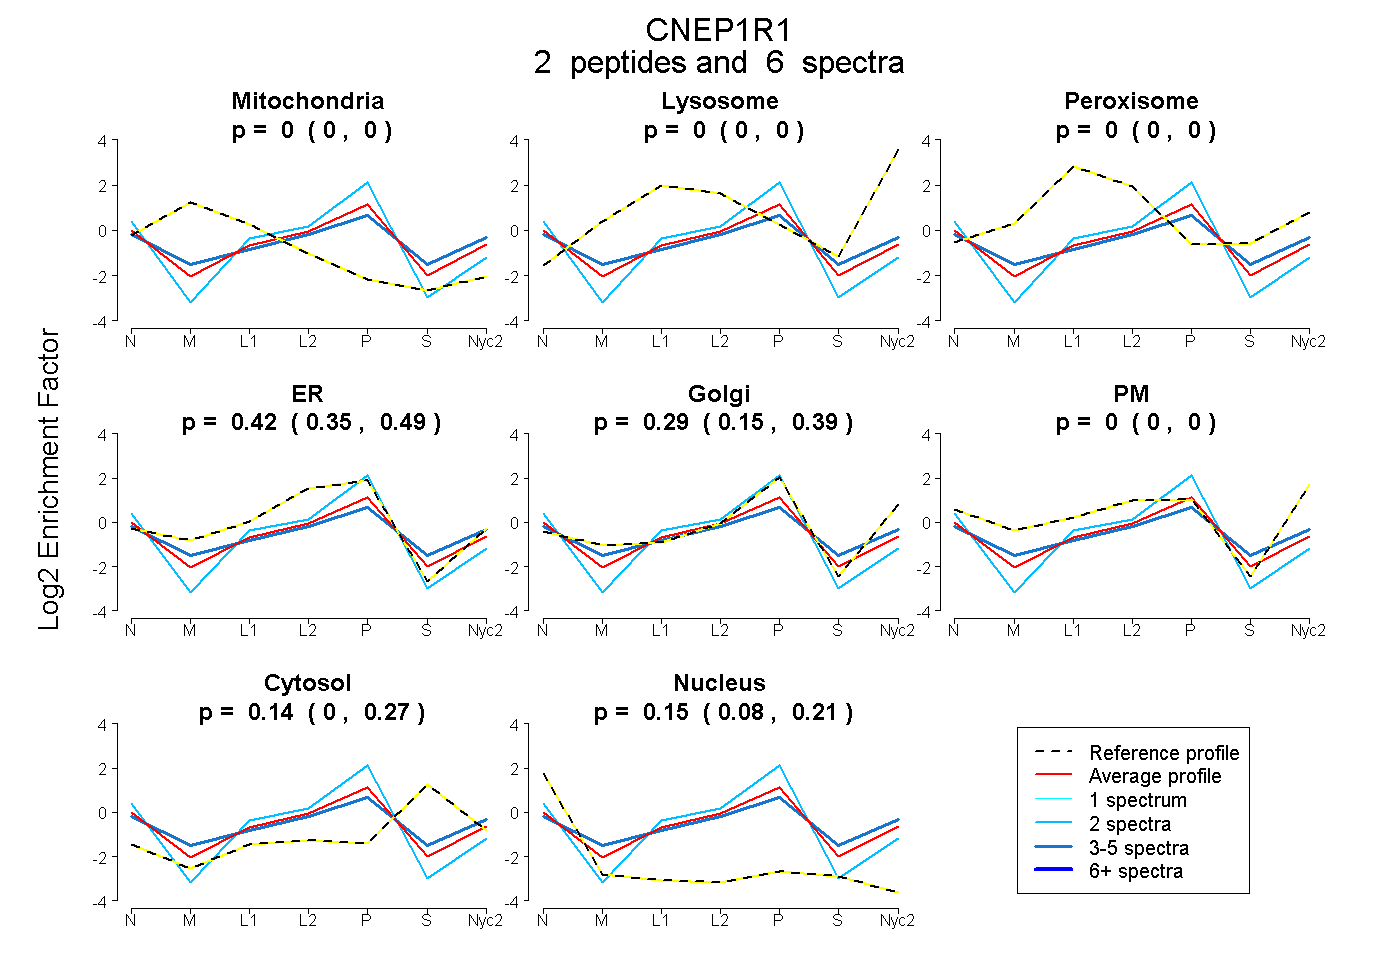
0.000 | 0.000
0.000 | 0.000
0.000 | 0.000
0.347 | 0.489
0.147 | 0.388
0.000 | 0.003
0.000 | 0.271
0.077 | 0.209
2peptides
spectra
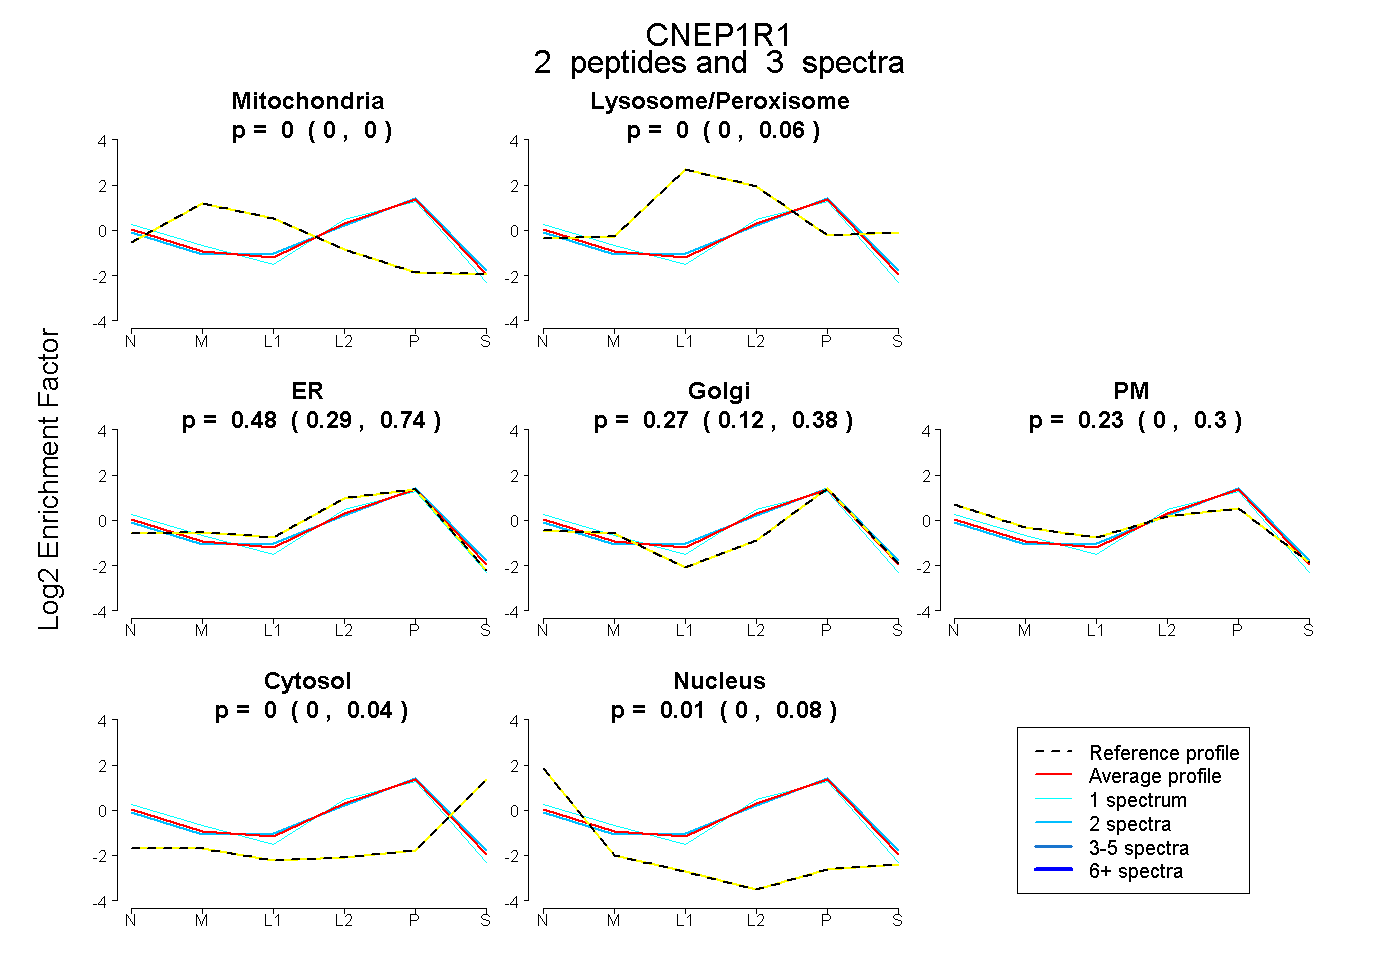
0.000 | 0.000
0.000 | 0.065
0.286 | 0.741
0.120 | 0.383
0.000 | 0.301
0.000 | 0.040
0.000 | 0.084