21
21peptides
spectra
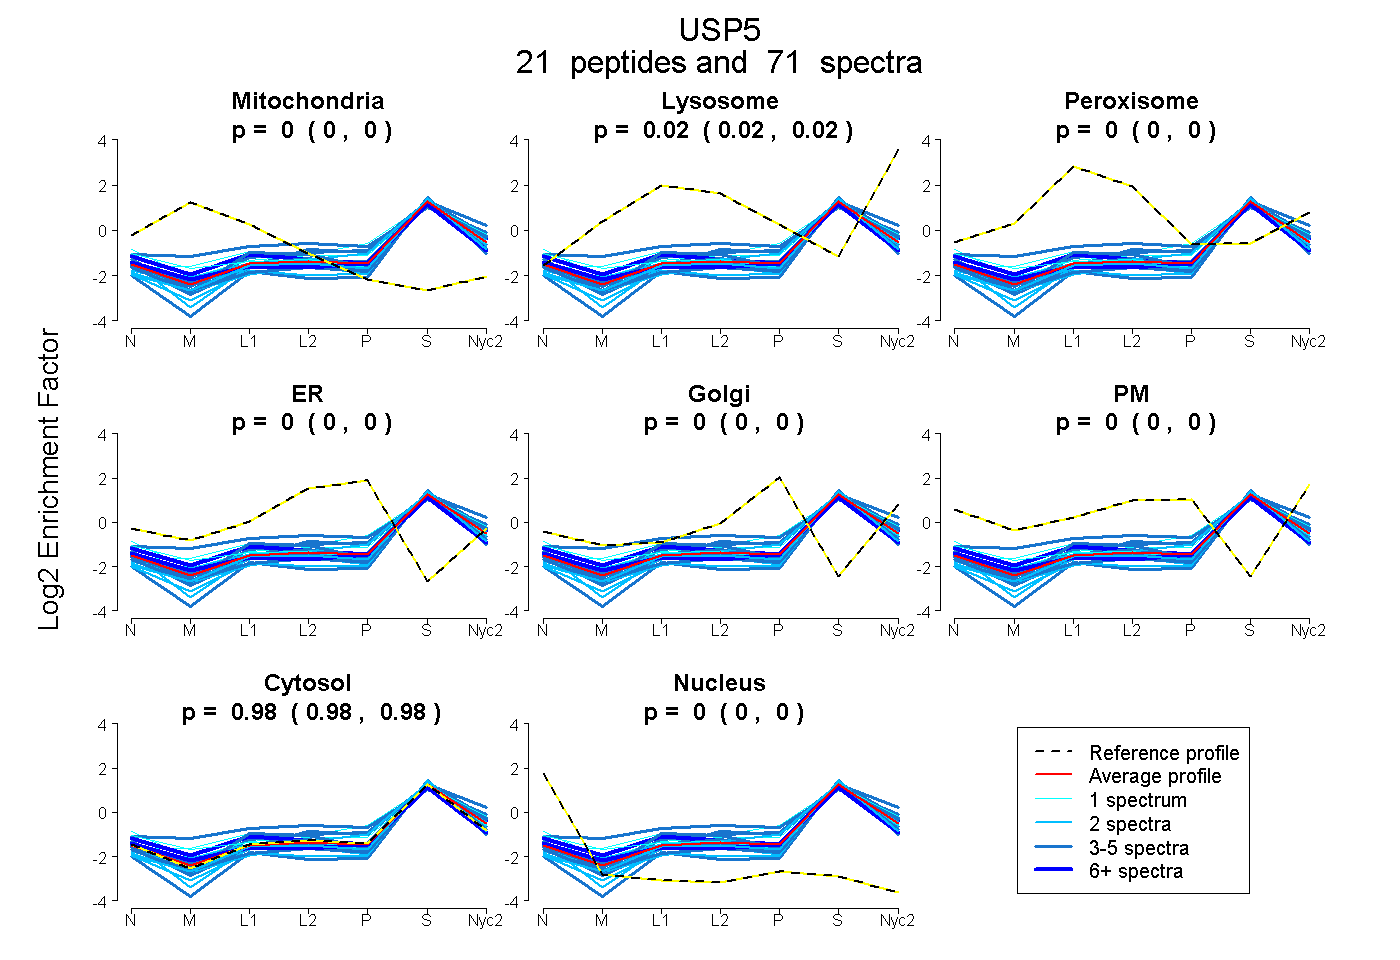
0.000 | 0.000
0.019 | 0.023
0.000 | 0.000
0.000 | 0.000
0.000 | 0.000
0.000 | 0.000
0.976 | 0.981
0.000 | 0.000
7peptides
spectra
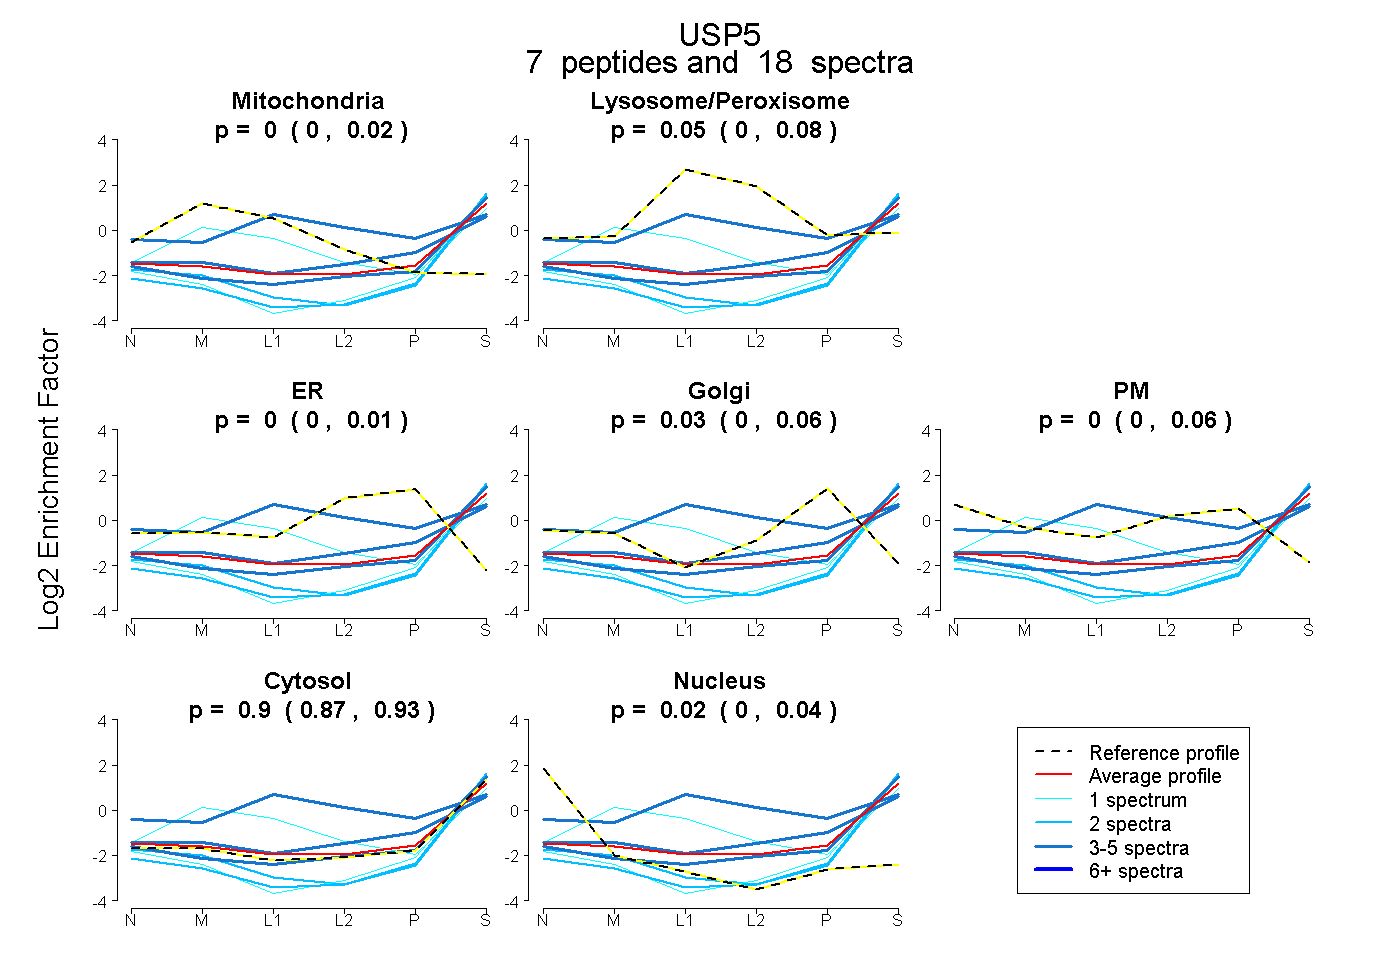
0.000 | 0.024
0.000 | 0.080
0.000 | 0.013
0.000 | 0.061
0.000 | 0.060
0.872 | 0.929
0.000 | 0.041