 21
21peptides
spectra
0.000 | 0.000
0.019 | 0.023
0.000 | 0.000
0.000 | 0.000
0.000 | 0.000
0.000 | 0.000
0.976 | 0.981
0.000 | 0.000
| Plot | Mito | Lyso | Perox | ER | Golgi | PM | Cytosol | Nucleus | |||||
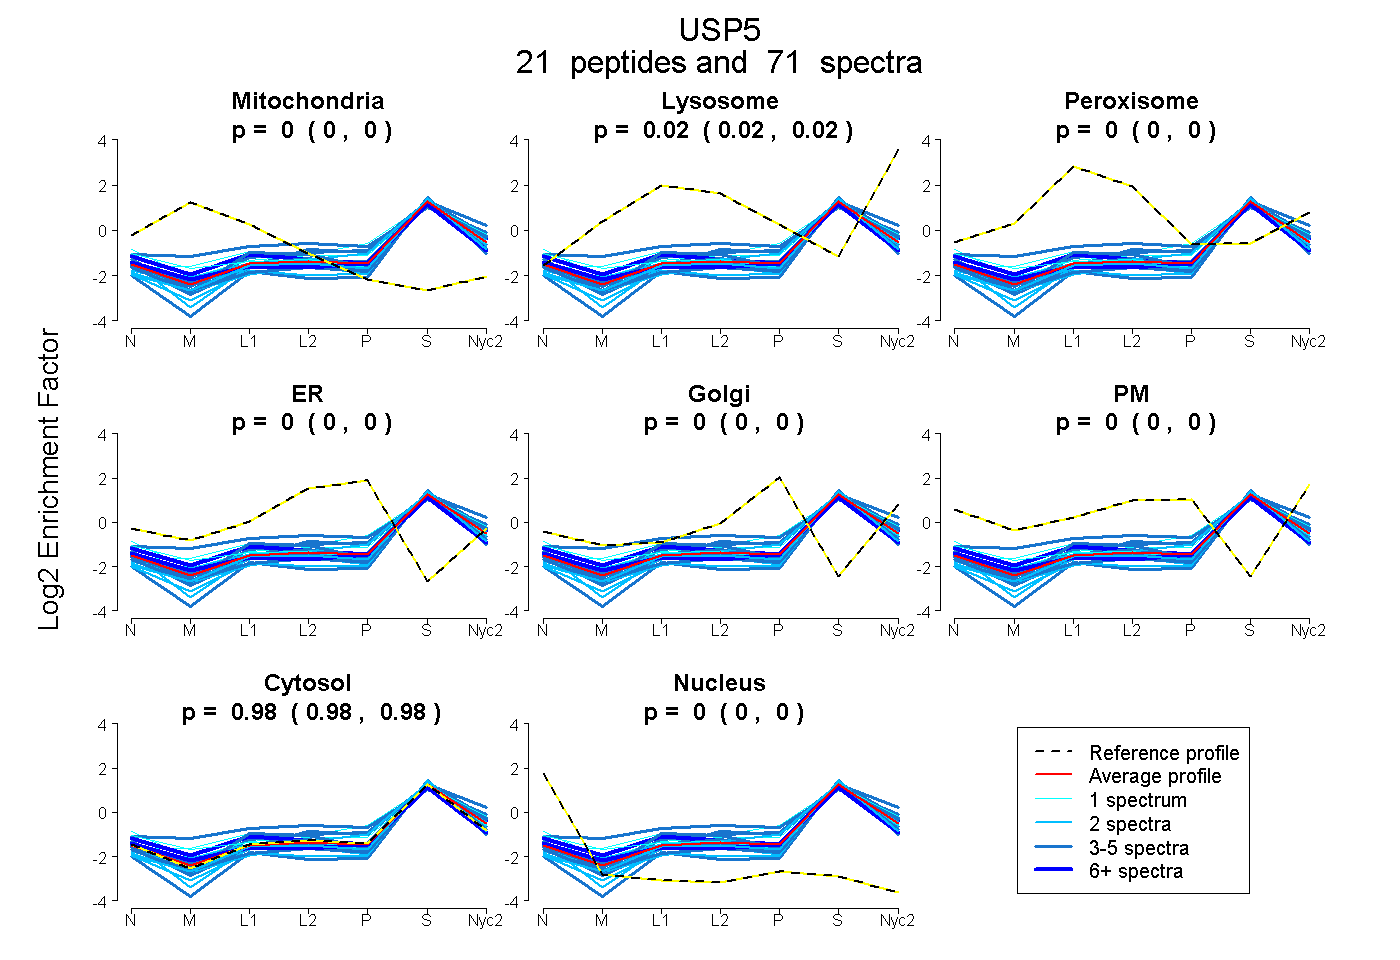
| Expt A |
21 peptides |
71 spectra |
|
0.000 0.000 | 0.000 |
0.021 0.019 | 0.023 |
0.000 0.000 | 0.000 |
0.000 0.000 | 0.000 |
0.000 0.000 | 0.000 |
0.000 0.000 | 0.000 |
0.979 0.976 | 0.981 |
0.000 0.000 | 0.000 |
| 2 spectra, FLVEEK | 0.000 | 0.000 | 0.000 | 0.000 | 0.000 | 0.000 | 1.000 | 0.000 | ||
| 11 spectra, VYLHLR | 0.037 | 0.000 | 0.000 | 0.000 | 0.000 | 0.000 | 0.941 | 0.022 | ||
| 4 spectra, DGLGGLPDIVR | 0.000 | 0.020 | 0.000 | 0.000 | 0.000 | 0.000 | 0.980 | 0.000 | ||
| 2 spectra, TMTELEIDMNQR | 0.003 | 0.043 | 0.000 | 0.000 | 0.000 | 0.000 | 0.954 | 0.000 | ||
| 7 spectra, QLDNPAR | 0.034 | 0.076 | 0.000 | 0.000 | 0.000 | 0.000 | 0.890 | 0.000 | ||
| 3 spectra, VCASEKPPK | 0.000 | 0.000 | 0.041 | 0.000 | 0.000 | 0.000 | 0.959 | 0.000 | ||
| 2 spectra, ETGYPLAVK | 0.000 | 0.000 | 0.000 | 0.000 | 0.000 | 0.000 | 1.000 | 0.000 | ||
| 1 spectrum, VTSAVEALLSADSASR | 0.056 | 0.070 | 0.000 | 0.000 | 0.000 | 0.000 | 0.874 | 0.000 | ||
| 3 spectra, EVQDGIAPR | 0.000 | 0.126 | 0.000 | 0.000 | 0.000 | 0.000 | 0.874 | 0.000 | ||
| 2 spectra, SAADSISESVPVGPK | 0.000 | 0.000 | 0.000 | 0.000 | 0.000 | 0.000 | 1.000 | 0.000 | ||
| 2 spectra, IVILPDYLEIAR | 0.000 | 0.000 | 0.000 | 0.000 | 0.000 | 0.000 | 0.999 | 0.001 | ||
| 1 spectrum, EELLEYEEK | 0.000 | 0.031 | 0.074 | 0.000 | 0.068 | 0.000 | 0.827 | 0.000 | ||
| 1 spectrum, GHPEFSTNR | 0.002 | 0.000 | 0.013 | 0.000 | 0.000 | 0.088 | 0.890 | 0.007 | ||
| 3 spectra, IPPCGWR | 0.015 | 0.115 | 0.115 | 0.000 | 0.045 | 0.000 | 0.710 | 0.000 | ||
| 3 spectra, DLGYIYFYQR | 0.000 | 0.000 | 0.000 | 0.000 | 0.000 | 0.000 | 0.970 | 0.030 | ||
| 3 spectra, QQDAQEFFLHLINMVER | 0.000 | 0.039 | 0.000 | 0.000 | 0.000 | 0.000 | 0.961 | 0.000 | ||
| 4 spectra, SSENPNEVFR | 0.000 | 0.000 | 0.000 | 0.000 | 0.000 | 0.000 | 0.948 | 0.052 | ||
| 5 spectra, ATNNSLER | 0.000 | 0.000 | 0.000 | 0.000 | 0.000 | 0.000 | 1.000 | 0.000 | ||
| 5 spectra, VALPELVR | 0.000 | 0.021 | 0.000 | 0.000 | 0.000 | 0.000 | 0.979 | 0.000 | ||
| 2 spectra, WVIYNDQK | 0.000 | 0.000 | 0.000 | 0.000 | 0.000 | 0.000 | 1.000 | 0.000 | ||
| 5 spectra, HAFNLK | 0.000 | 0.068 | 0.000 | 0.000 | 0.033 | 0.000 | 0.899 | 0.000 |
| Plot | Mito | Lyso or Perox | ER | Golgi | PM | Cytosol | Nucleus | ||||||
| Expt B |
7 peptides |
18 spectra |
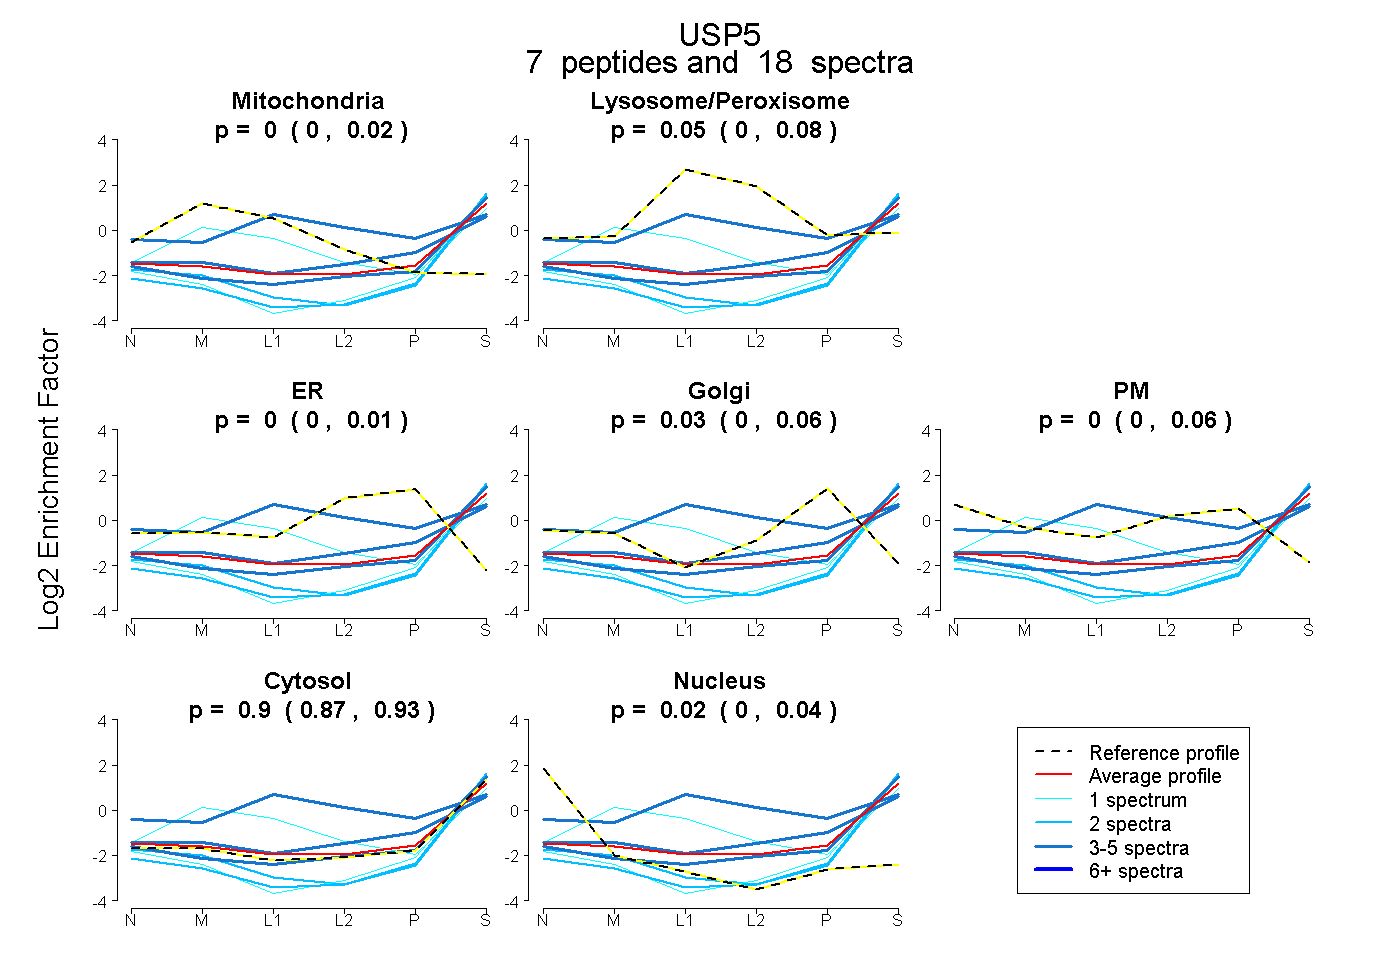 |
0.000 0.000 | 0.024 |
0.046 0.000 | 0.080 |
0.000 0.000 | 0.013 |
0.032 0.000 | 0.061 |
0.000 0.000 | 0.060 |
0.901 0.872 | 0.929 |
0.021 0.000 | 0.041 |
|||
| Plot | Lyso | Other | |||||||||||
| Expt C |
12 peptides |
53 spectra |
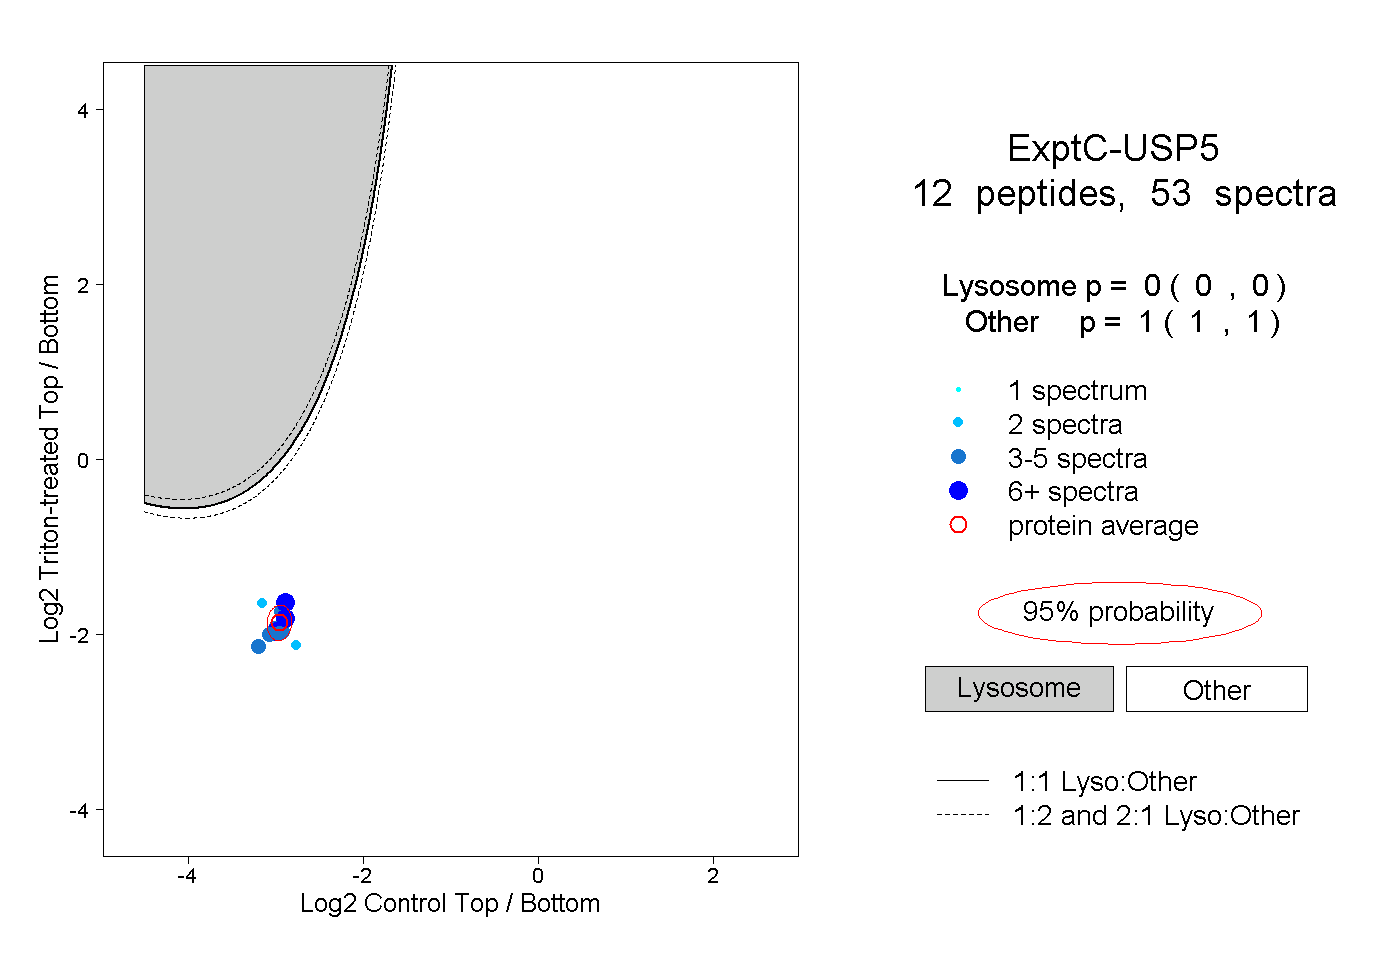 |
0.000 0.000 | 0.000 |
1.000 1.000 | 1.000 |
||||||||
| Plot | Lyso | Other | |||||||||||
| Expt D |
2 peptides |
4 spectra |
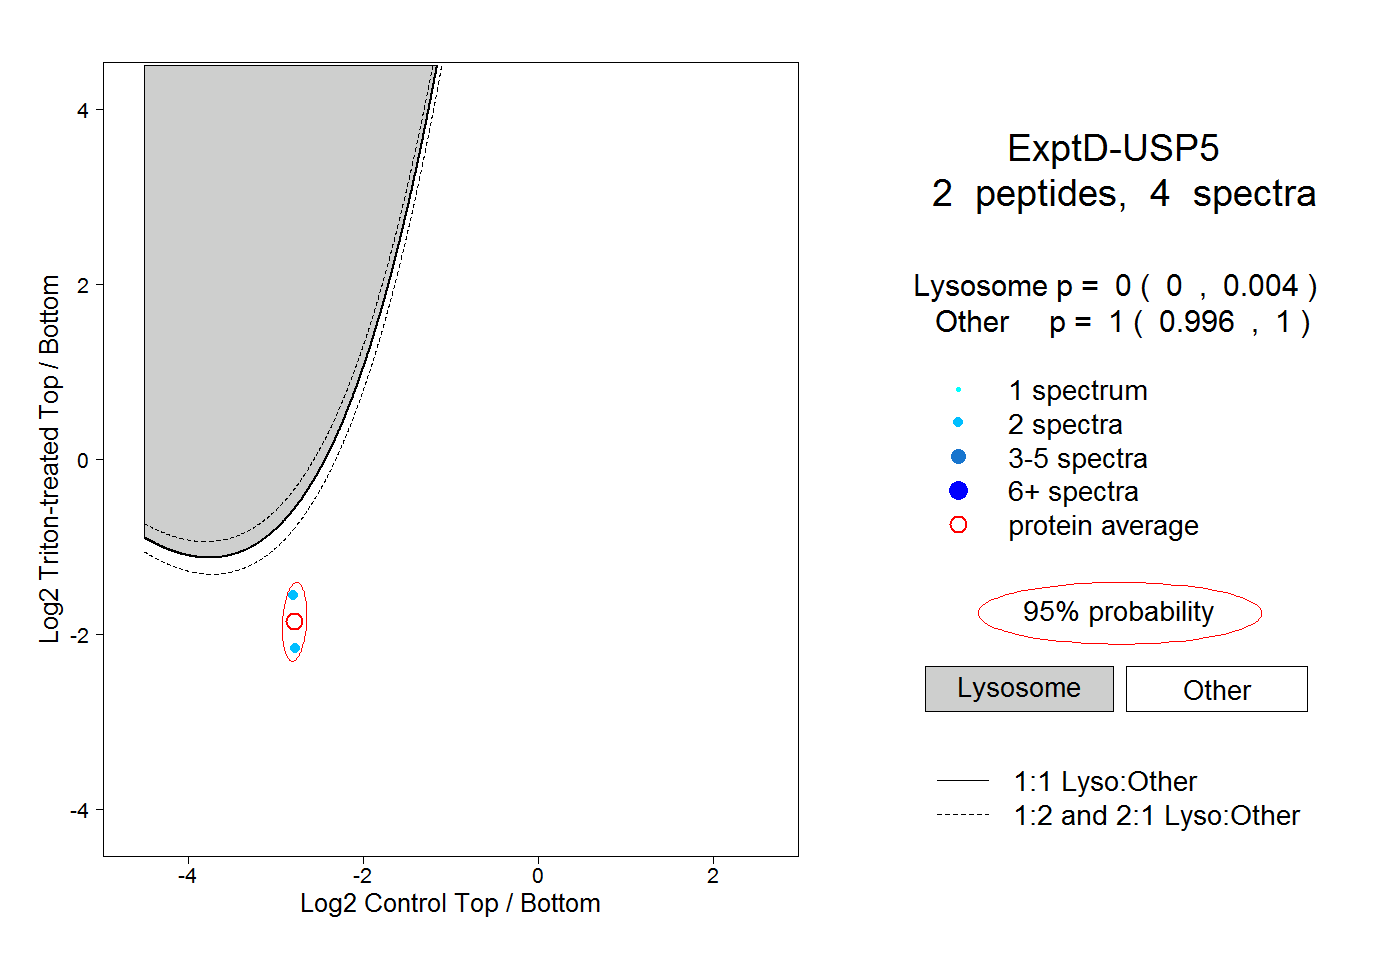 |
0.000 0.000 | 0.004 |
1.000 0.996 | 1.000 |