 37
37peptides
spectra
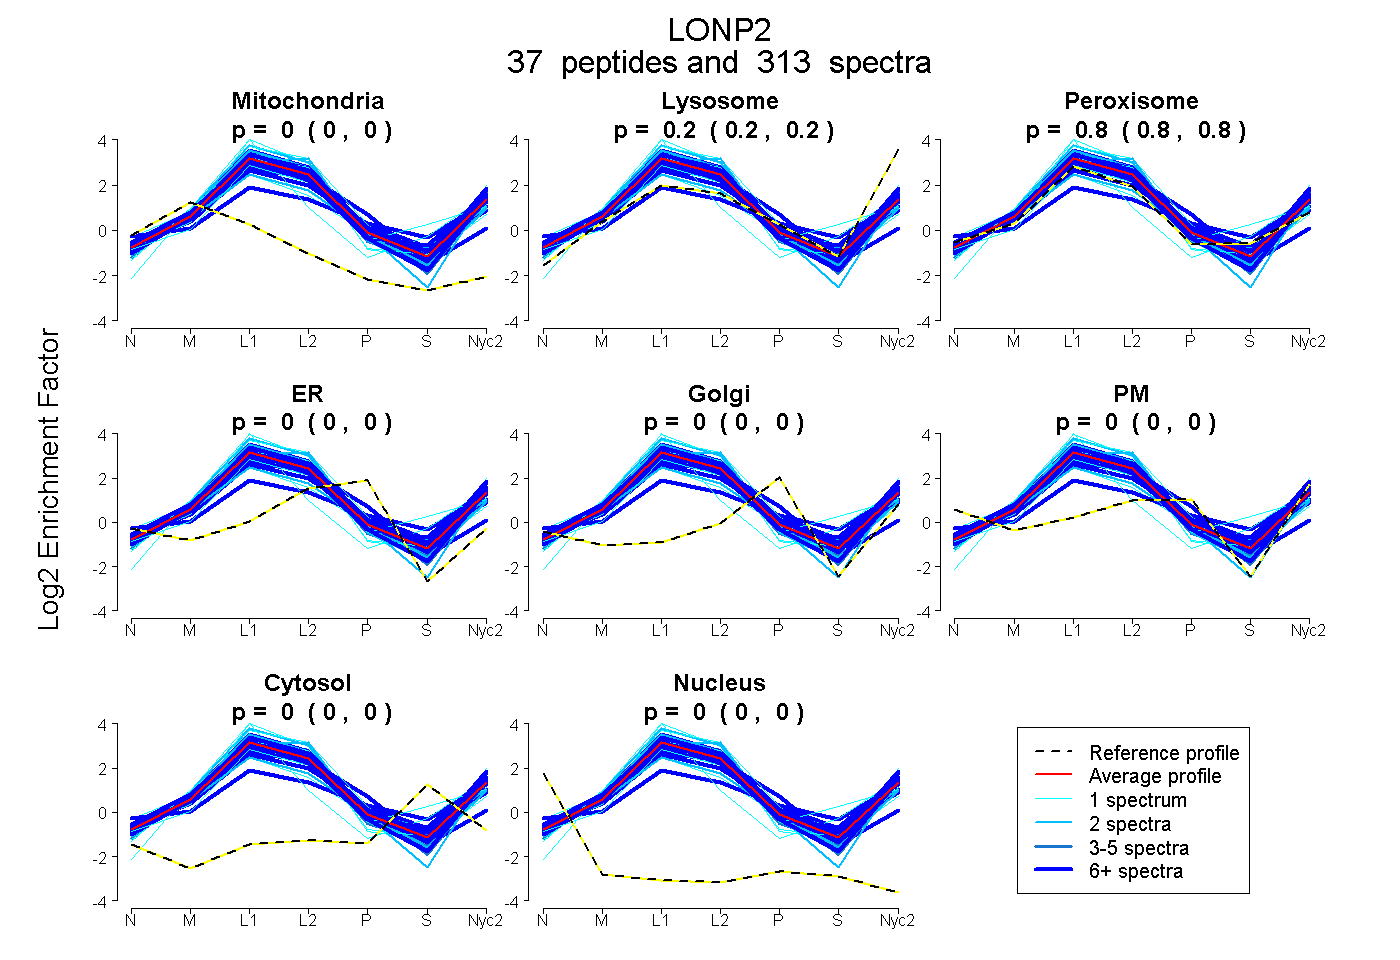
0.000 | 0.000
0.199 | 0.203
0.796 | 0.800
0.000 | 0.000
0.000 | 0.000
0.000 | 0.000
0.000 | 0.000
0.000 | 0.000
28peptides
spectra
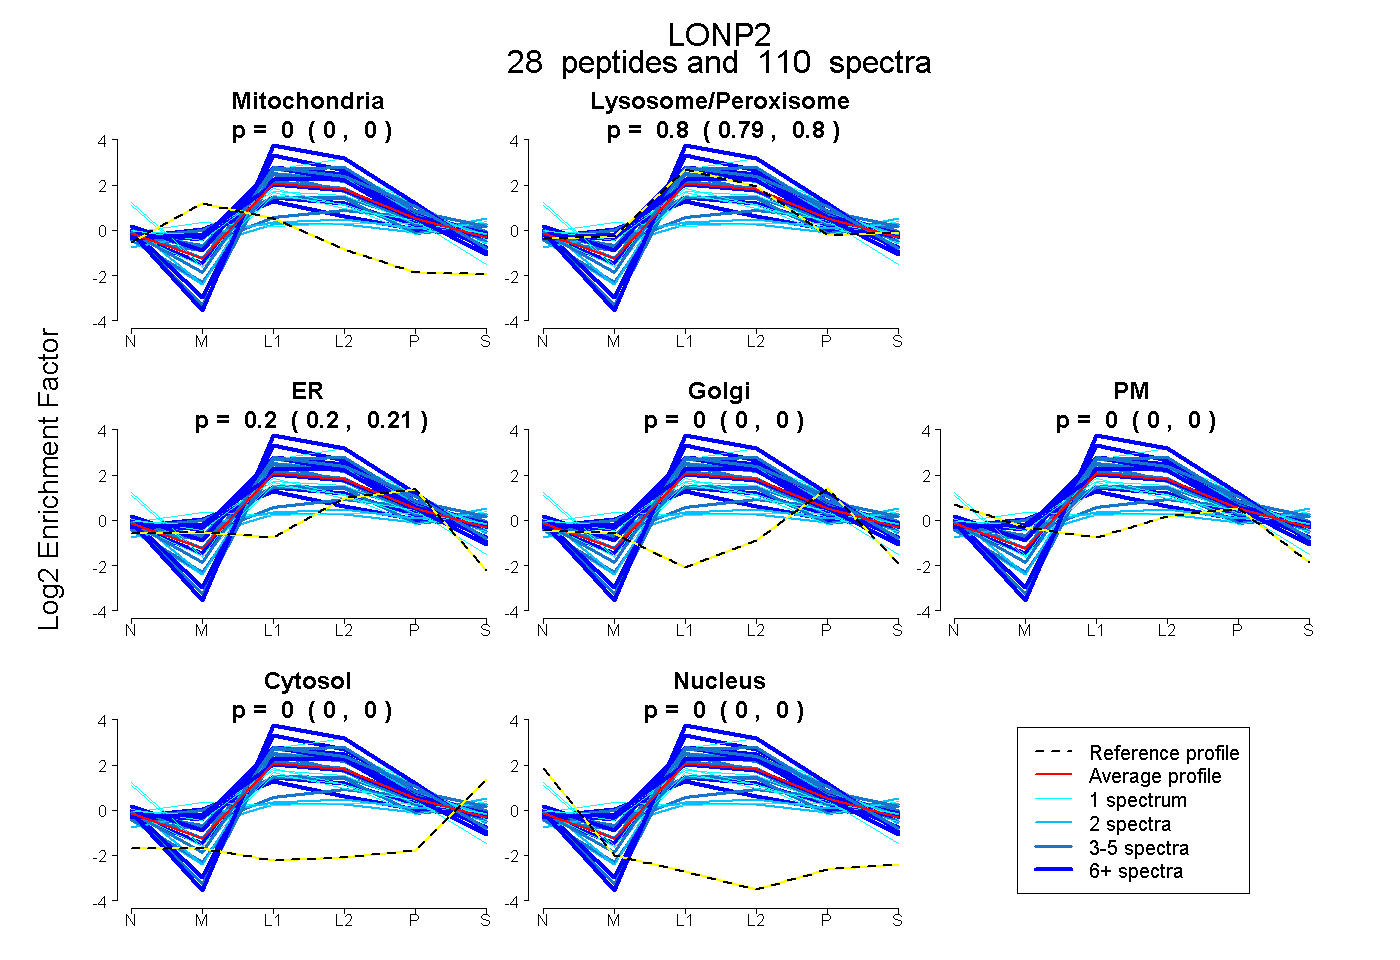
0.000 | 0.000
0.791 | 0.802
0.197 | 0.208
0.000 | 0.000
0.000 | 0.000
0.000 | 0.002
0.000 | 0.000
39peptides
spectra
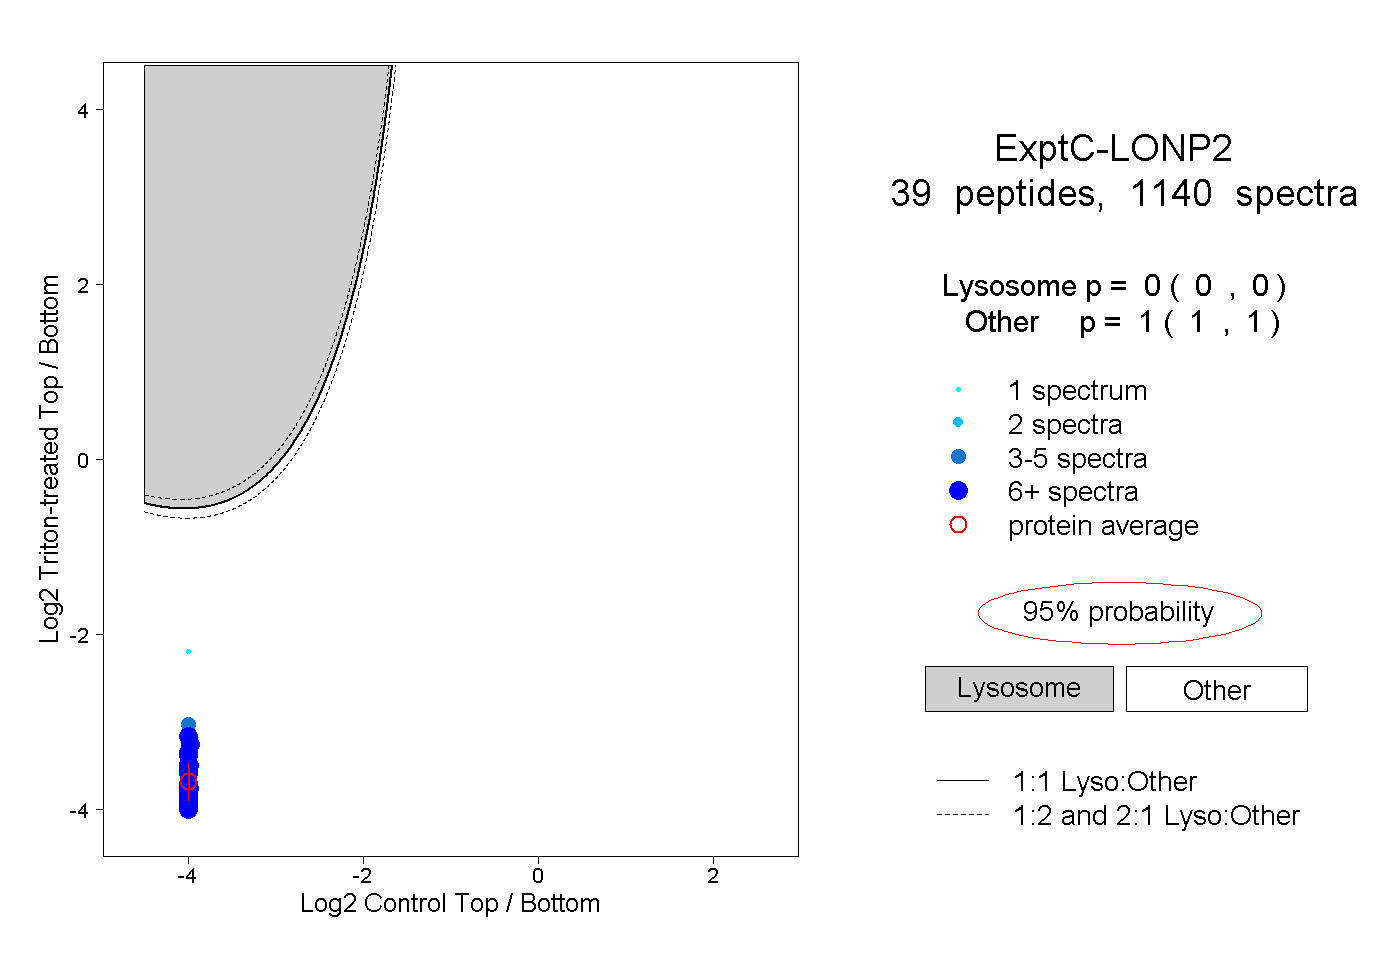
0.000 | 0.000
1.000 | 1.000
24peptides
spectra
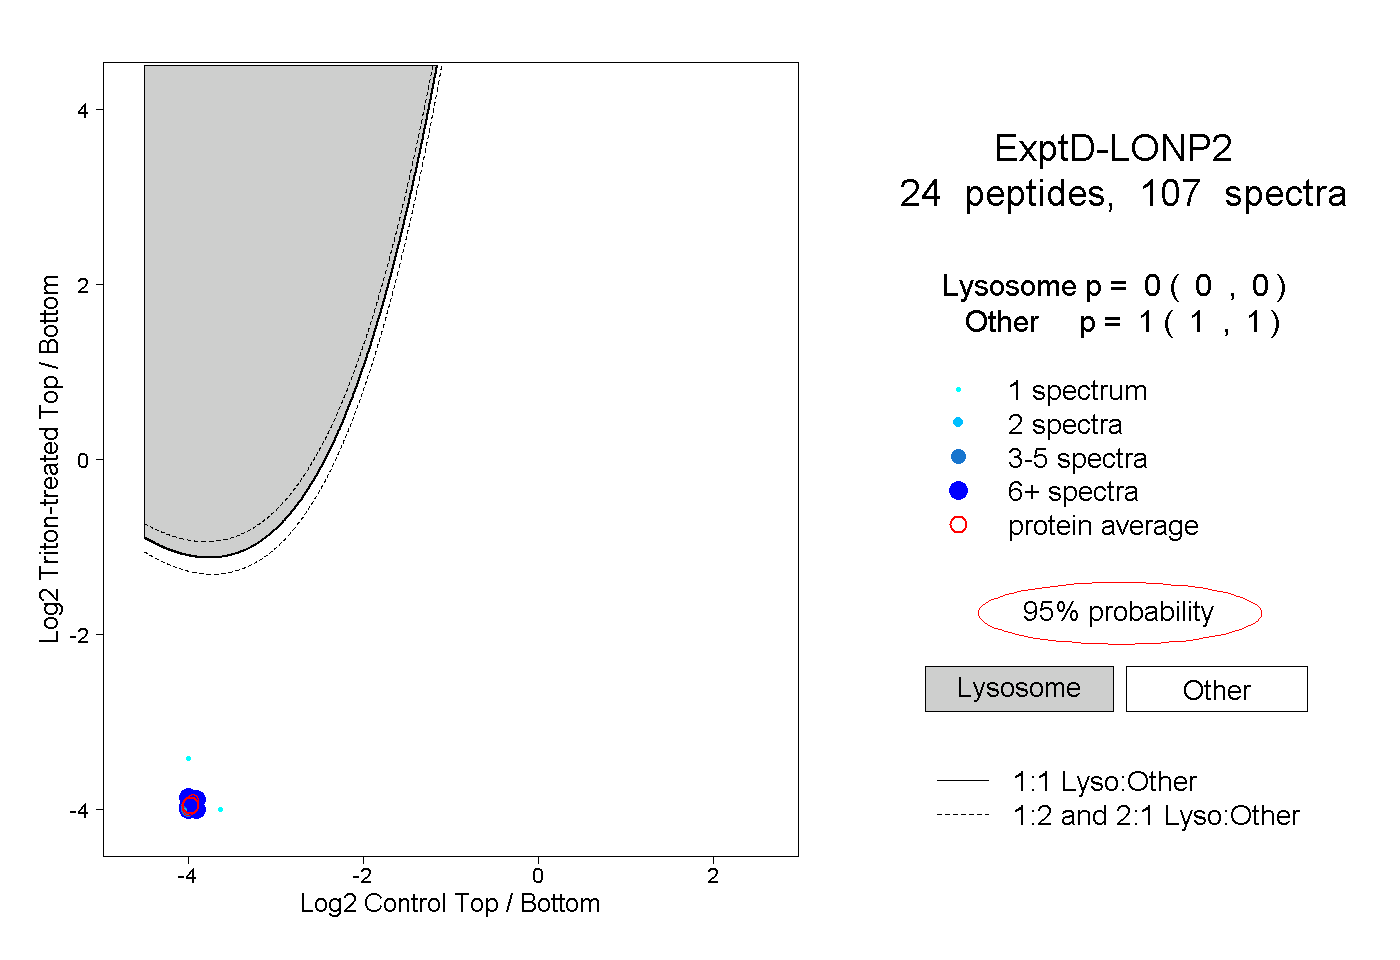
0.000 | 0.000
1.000 | 1.000