 4
4peptides
spectra
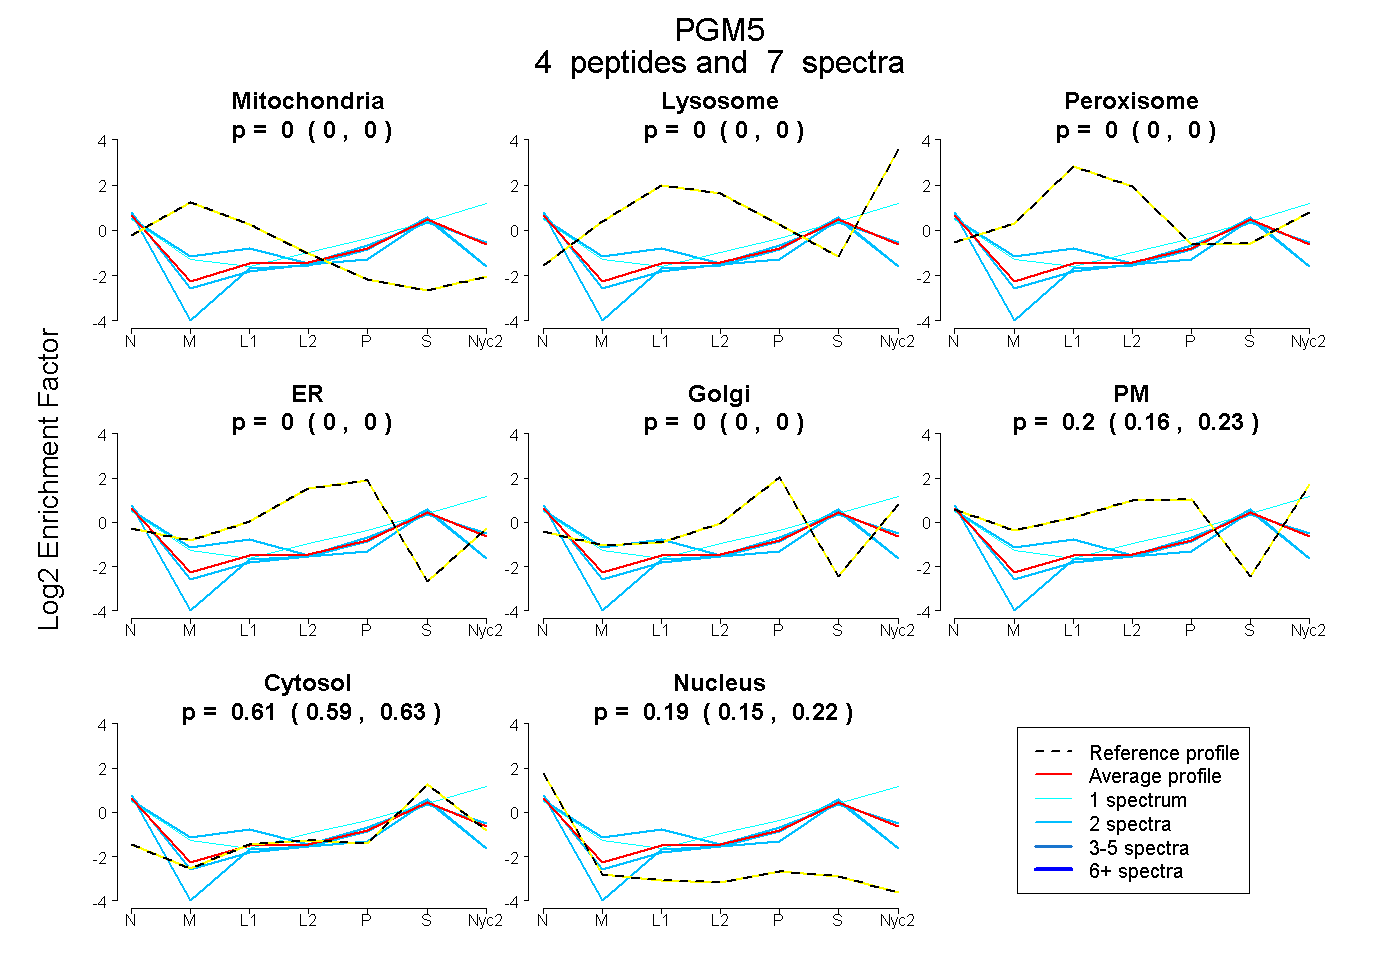
0.000 | 0.000
0.000 | 0.000
0.000 | 0.000
0.000 | 0.000
0.000 | 0.000
0.156 | 0.232
0.592 | 0.633
0.154 | 0.218
3peptides
spectra
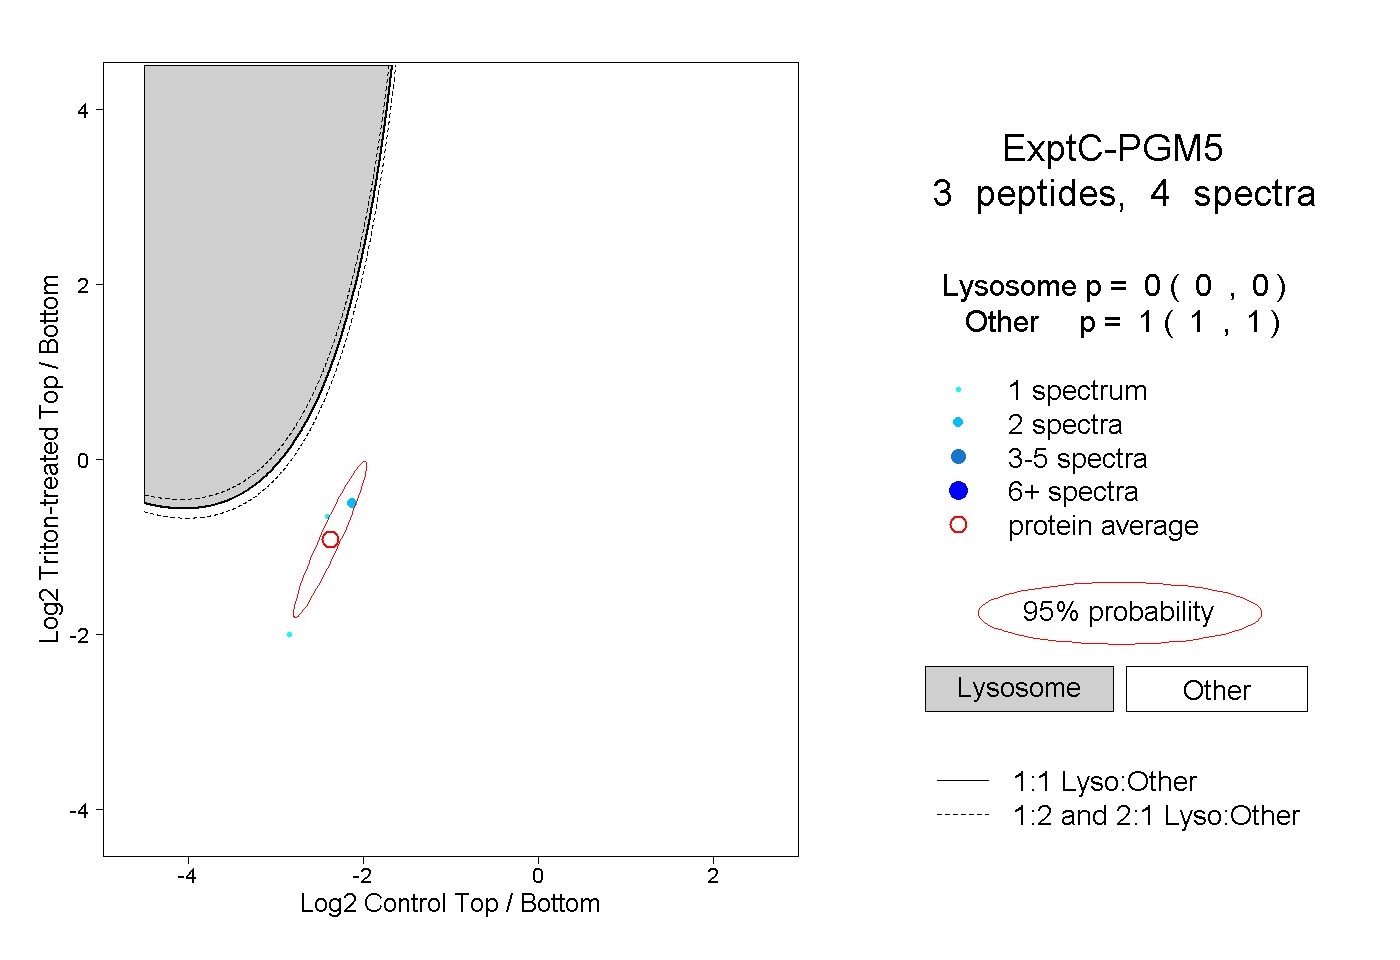
0.000 | 0.000
1.000 | 1.000
| Plot | Mito | Lyso | Perox | ER | Golgi | PM | Cytosol | Nucleus | |||||
| Expt A |
4 peptides |
7 spectra |
|
0.000 0.000 | 0.000 |
0.000 0.000 | 0.000 |
0.000 0.000 | 0.000 |
0.000 0.000 | 0.000 |
0.000 0.000 | 0.000 |
0.197 0.156 | 0.232 |
0.615 0.592 | 0.633 |
0.188 0.154 | 0.218 |
||
| Plot | Lyso | Other | |||||||||||
| Expt C |
3 peptides |
4 spectra |
|
0.000 0.000 | 0.000 |
1.000 1.000 | 1.000 |
| 2 spectra, SLLTGPSQLK | 0.000 | 1.000 | ||||||||
| 1 spectrum, QSVEEIVR | 0.000 | 1.000 | ||||||||
| 1 spectrum, TIEEYTICPDLR | 0.000 | 1.000 |