 8
8peptides
spectra
0.000 | 0.020
0.000 | 0.000
0.798 | 0.838
0.054 | 0.093
0.000 | 0.008
0.000 | 0.000
0.083 | 0.100
0.000 | 0.000
| Plot | Mito | Lyso | Perox | ER | Golgi | PM | Cytosol | Nucleus | |||||
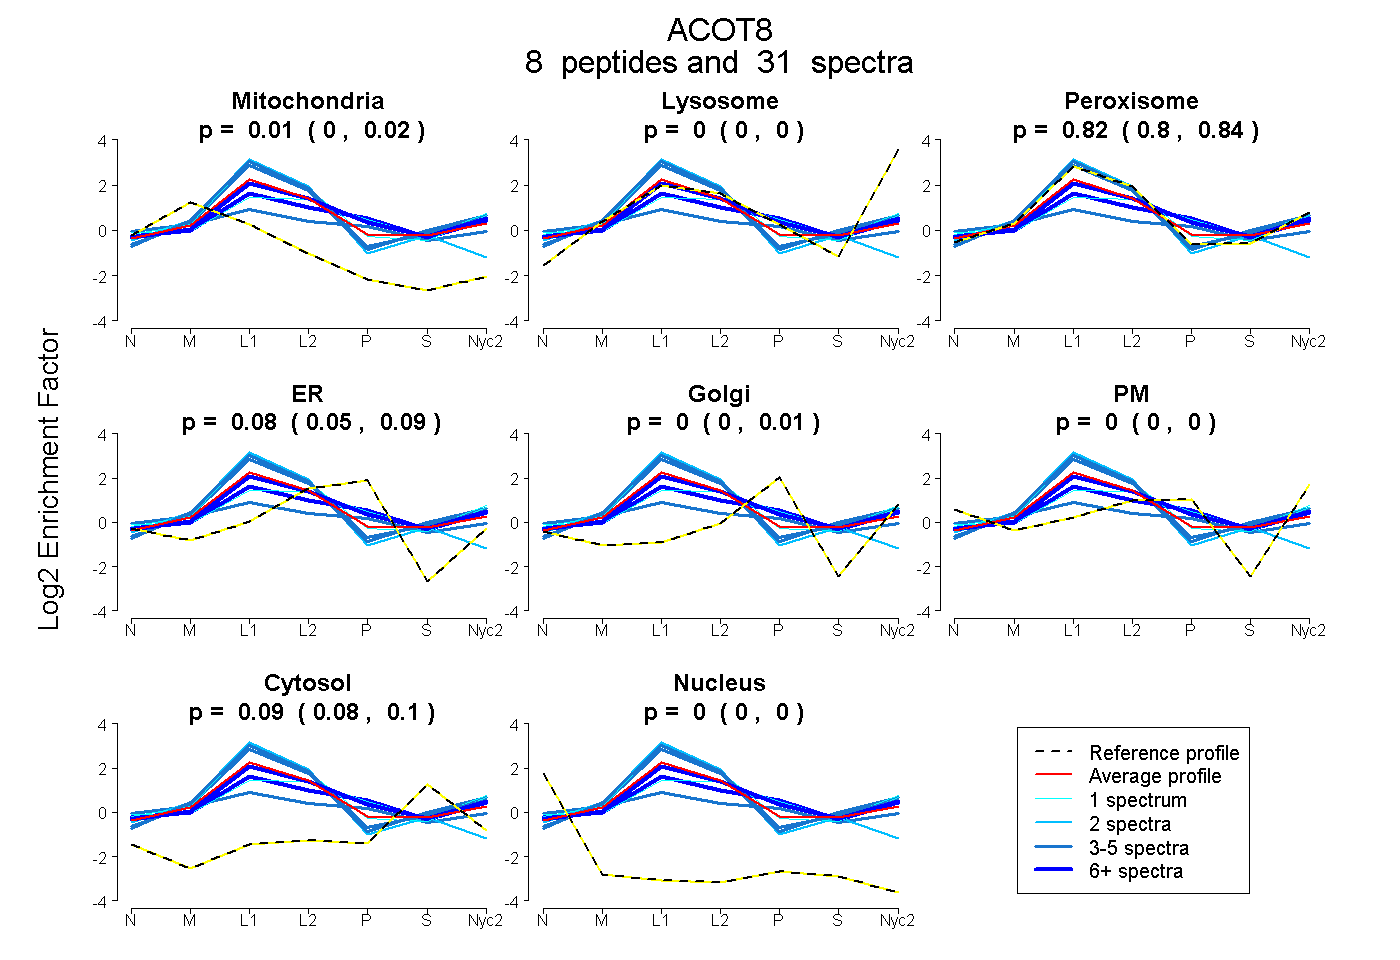
| Expt A |
8 peptides |
31 spectra |
|
0.010 0.000 | 0.020 |
0.000 0.000 | 0.000 |
0.820 0.798 | 0.838 |
0.077 0.054 | 0.093 |
0.000 0.000 | 0.008 |
0.000 0.000 | 0.000 |
0.093 0.083 | 0.100 |
0.000 0.000 | 0.000 |
| 2 spectra, DGVLAVTCAQEGVIR | 0.155 | 0.000 | 0.845 | 0.000 | 0.000 | 0.000 | 0.000 | 0.000 | ||
| 5 spectra, GDLSGDLR | 0.000 | 0.000 | 0.955 | 0.000 | 0.000 | 0.000 | 0.045 | 0.000 | ||
| 1 spectrum, LVNPPALNQLQTLEPK | 0.000 | 0.000 | 0.987 | 0.013 | 0.000 | 0.000 | 0.000 | 0.000 | ||
| 3 spectra, ADHWMLYECESPWAGGSR | 0.145 | 0.000 | 0.475 | 0.000 | 0.247 | 0.000 | 0.133 | 0.000 | ||
| 7 spectra, VPVLYHVER | 0.000 | 0.000 | 0.760 | 0.059 | 0.125 | 0.000 | 0.056 | 0.000 | ||
| 1 spectrum, LFGGQIVGQALVAAAK | 0.000 | 0.000 | 0.641 | 0.000 | 0.174 | 0.107 | 0.078 | 0.000 | ||
| 7 spectra, HYWVPTSQR | 0.000 | 0.000 | 0.666 | 0.000 | 0.248 | 0.000 | 0.086 | 0.000 | ||
| 5 spectra, QMFWVR | 0.000 | 0.000 | 0.989 | 0.000 | 0.000 | 0.000 | 0.011 | 0.000 |
| Plot | Mito | Lyso or Perox | ER | Golgi | PM | Cytosol | Nucleus | ||||||
| Expt B |
4 peptides |
9 spectra |
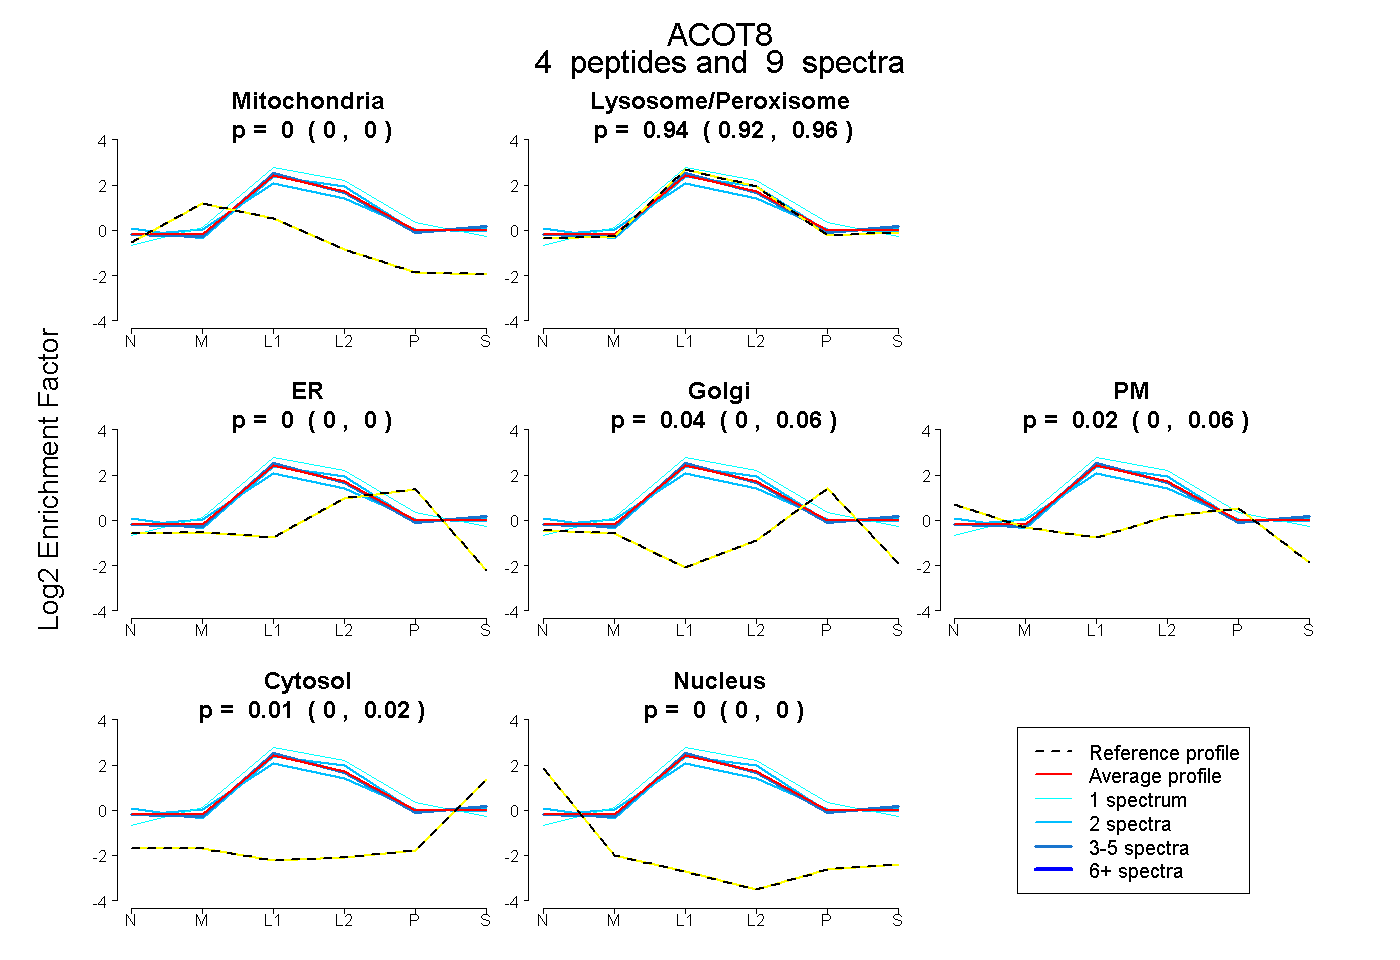 |
0.000 0.000 | 0.000 |
0.941 0.916 | 0.956 |
0.000 0.000 | 0.000 |
0.039 0.000 | 0.058 |
0.016 0.000 | 0.062 |
0.005 0.000 | 0.017 |
0.000 0.000 | 0.000 |
|||
| Plot | Lyso | Other | |||||||||||
| Expt C |
13 peptides |
106 spectra |
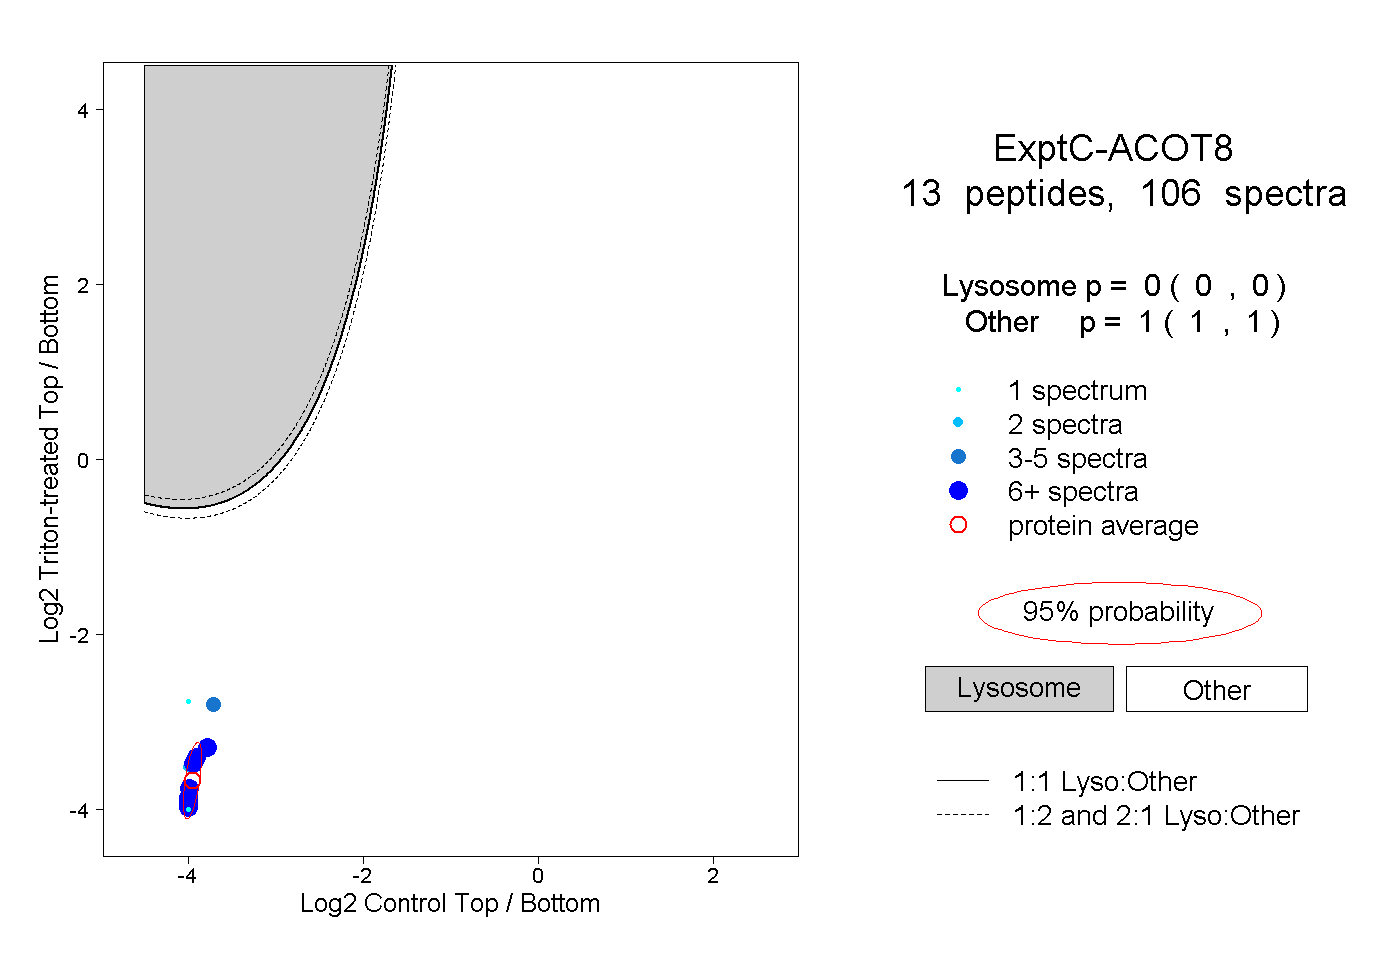 |
0.000 0.000 | 0.000 |
1.000 1.000 | 1.000 |
||||||||
| Plot | Lyso | Other | |||||||||||
| Expt D |
7 peptides |
18 spectra |
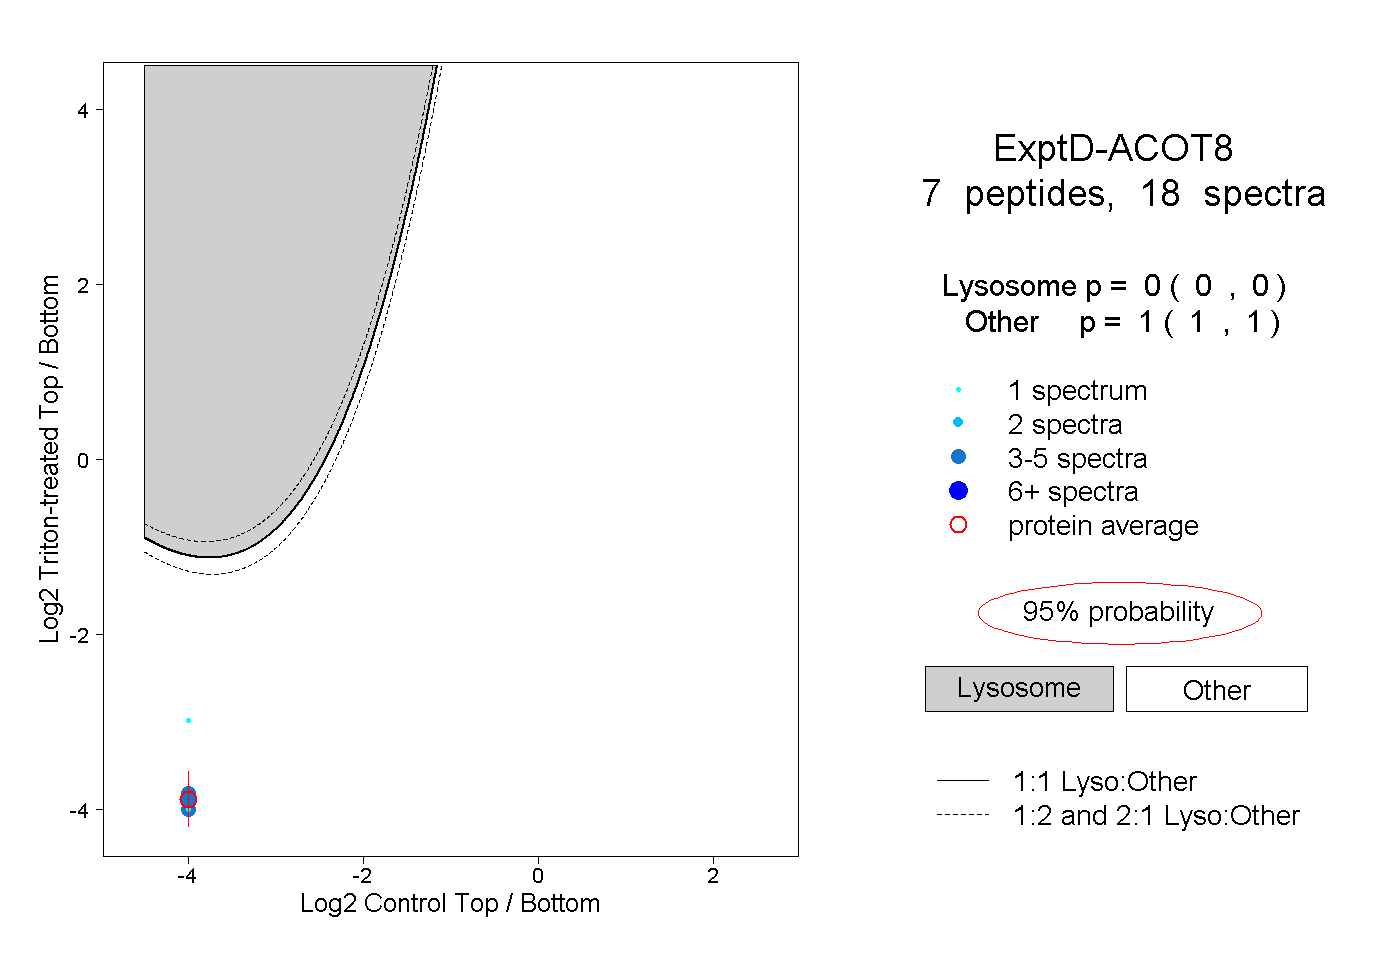 |
0.000 0.000 | 0.000 |
1.000 1.000 | 1.000 |