 1
1peptide
spectra
0.224 | 0.551
0.000 | 0.018
0.061 | 0.280
0.000 | 0.348
0.000 | 0.279
0.000 | 0.152
0.034 | 0.232
0.000 | 0.091
1peptide
spectra
0.000 | 0.000
1.000 | 1.000
| Plot | Mito | Lyso | Perox | ER | Golgi | PM | Cytosol | Nucleus | |||||
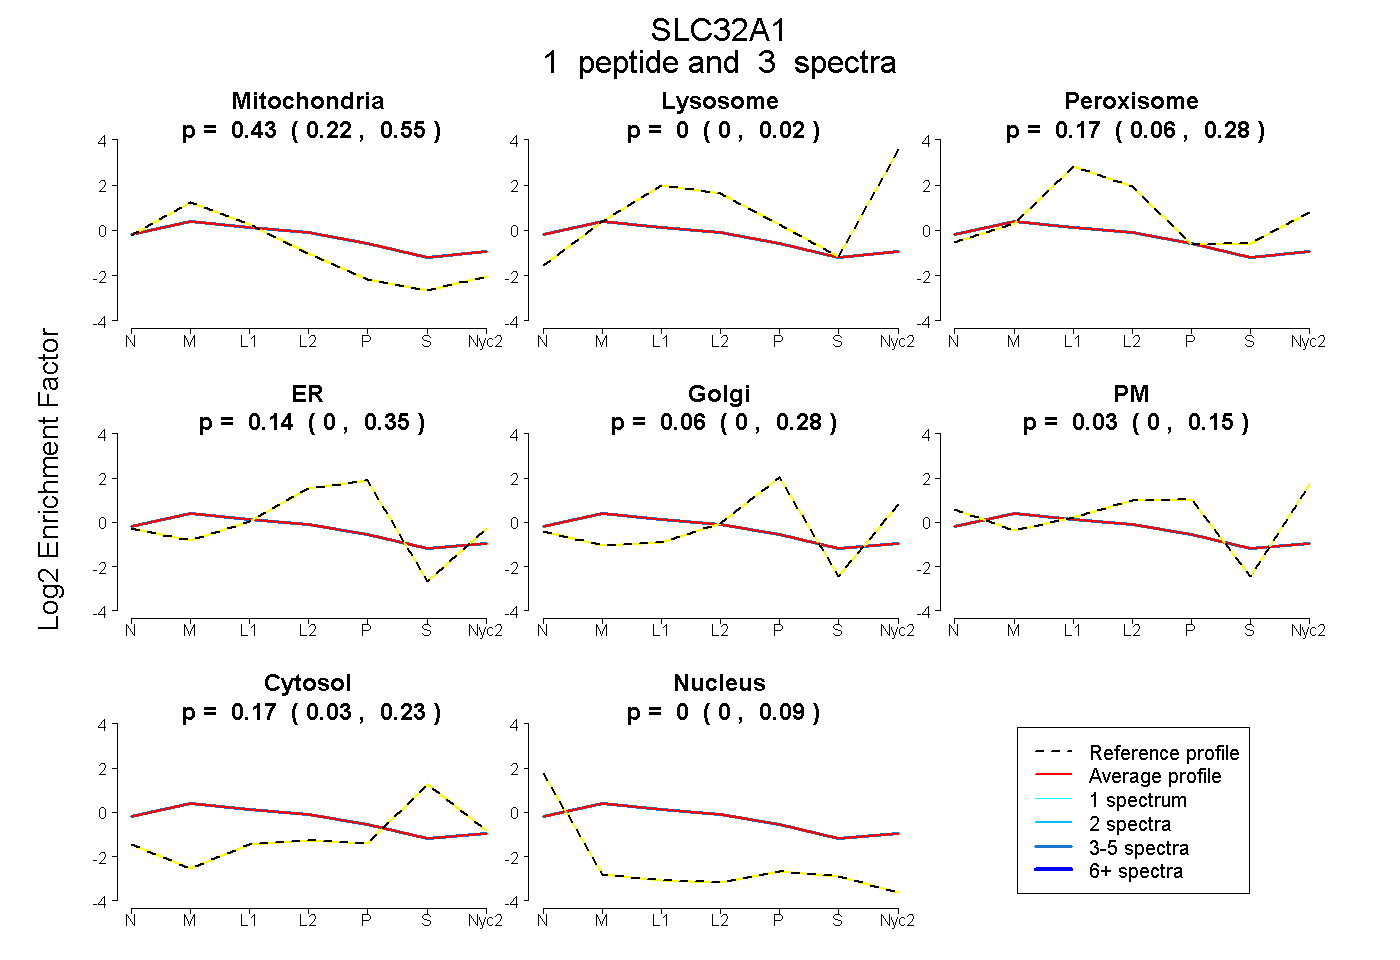
| Expt A |
1 peptide |
3 spectra |
|
0.427 0.224 | 0.551 |
0.000 0.000 | 0.018 |
0.169 0.061 | 0.280 |
0.137 0.000 | 0.348 |
0.063 0.000 | 0.279 |
0.034 0.000 | 0.152 |
0.170 0.034 | 0.232 |
0.000 0.000 | 0.091 |
||
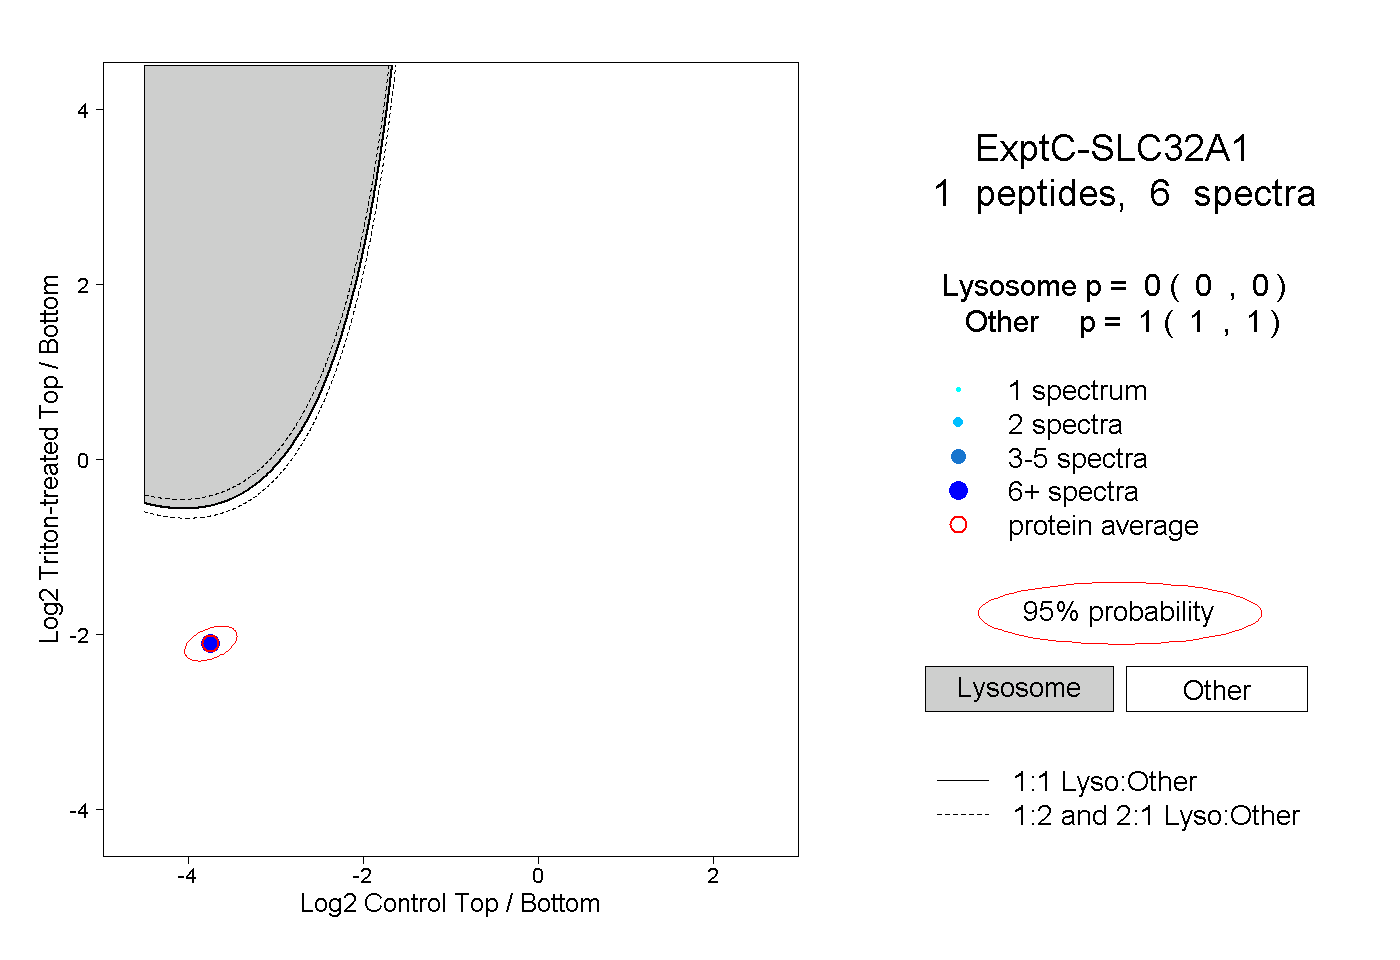
| Plot | Lyso | Other | |||||||||||
| Expt C |
1 peptide |
6 spectra |
|
0.000 0.000 | 0.000 |
1.000 1.000 | 1.000 |