DNAJC25
[ENSRNOP00000020702]
Main page
| | | Plot |
Mito |
Lyso |
|
Perox |
ER |
Golgi |
PM |
Cytosol |
Nucleus |
|
| Expt A |
 8
8
peptides |
17
spectra |
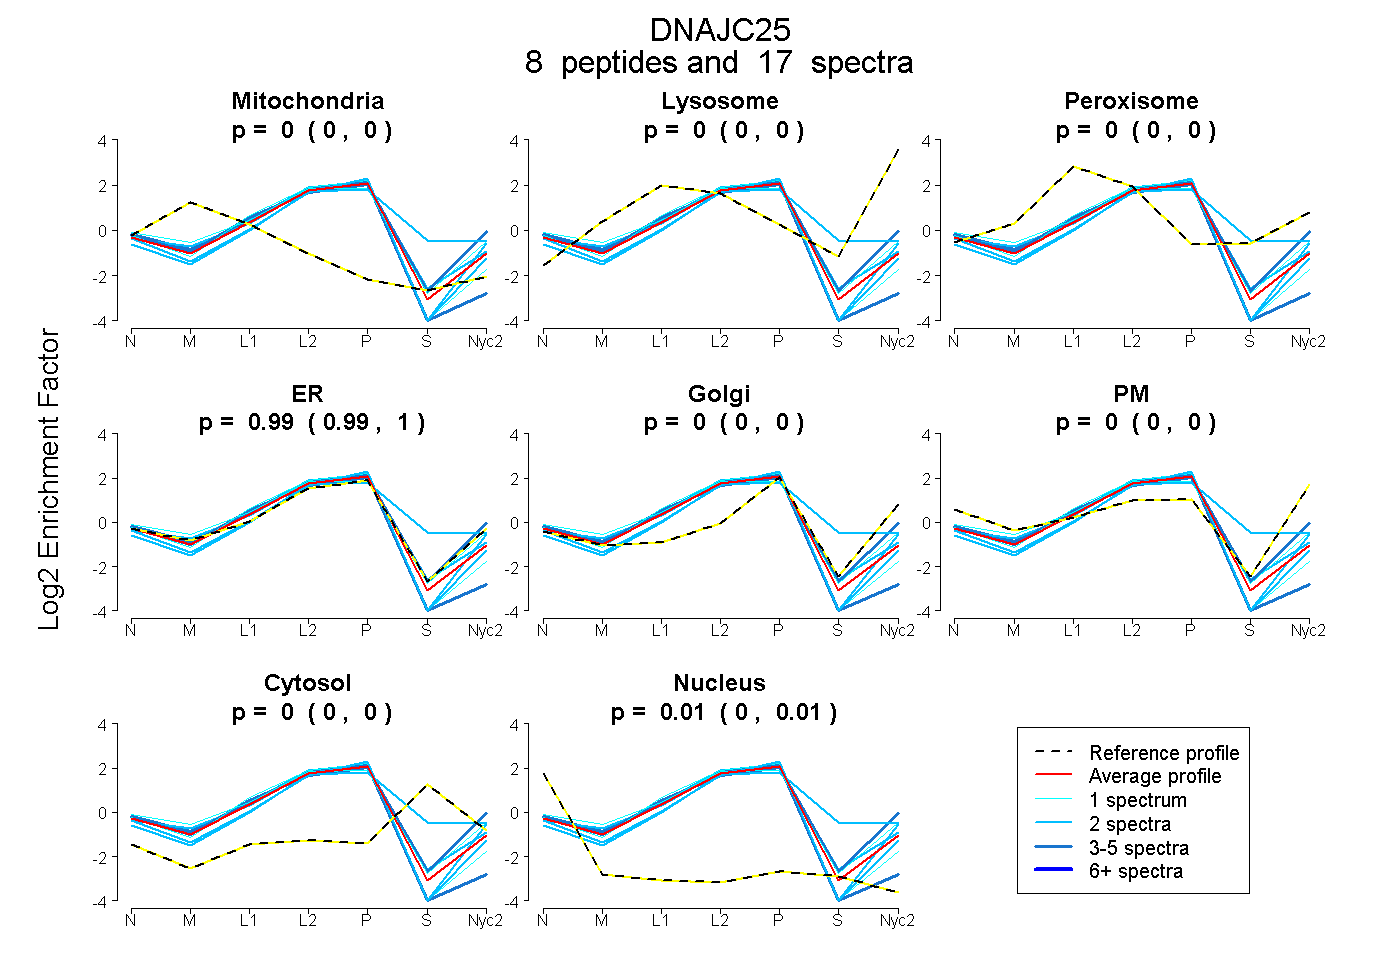 |
0.000
0.000 | 0.000 |
0.000
0.000 | 0.000 |
|
0.000
0.000 | 0.000 |
0.995
0.987 | 1.000 |
0.000
0.000 | 0.000 |
0.000
0.000 | 0.000 |
0.000
0.000 | 0.000 |
0.005
0.000 | 0.012 |
|
| | | Plot |
Mito |
|
Lyso or Perox |
|
ER |
Golgi |
PM |
Cytosol |
Nucleus |
|
| Expt B |
2
peptides |
3
spectra |
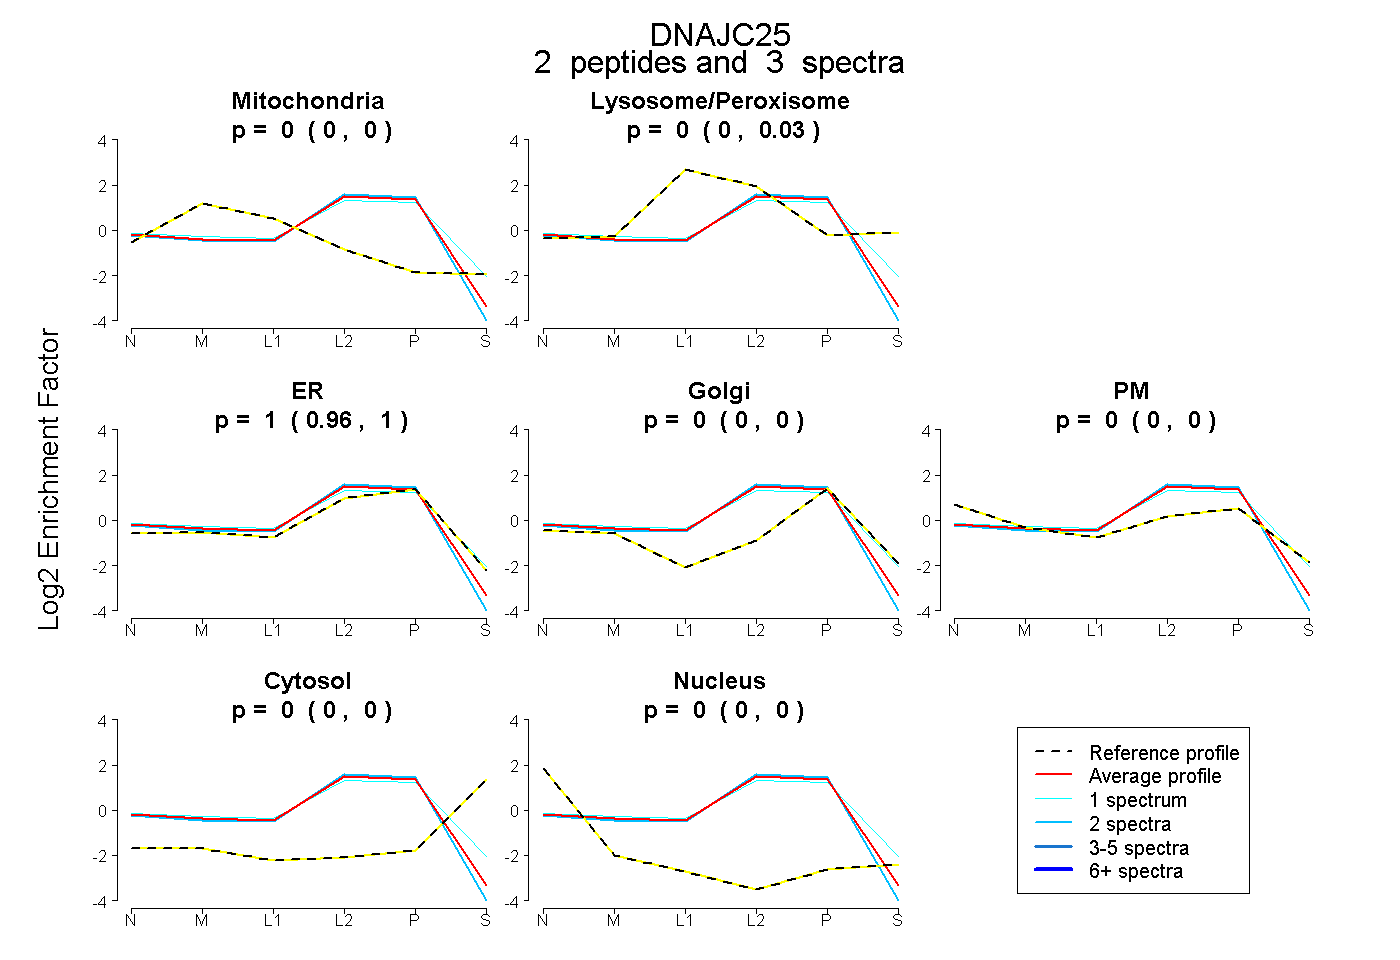 |
0.000
0.000 | 0.000 |
|
0.000
0.000 | 0.029 |
|
1.000
0.958 | 1.000 |
0.000
0.000 | 0.000 |
0.000
0.000 | 0.000 |
0.000
0.000 | 0.000 |
0.000
0.000 | 0.000 |
|
| | | Plot |
|
Lyso |
|
|
|
|
|
|
|
Other |
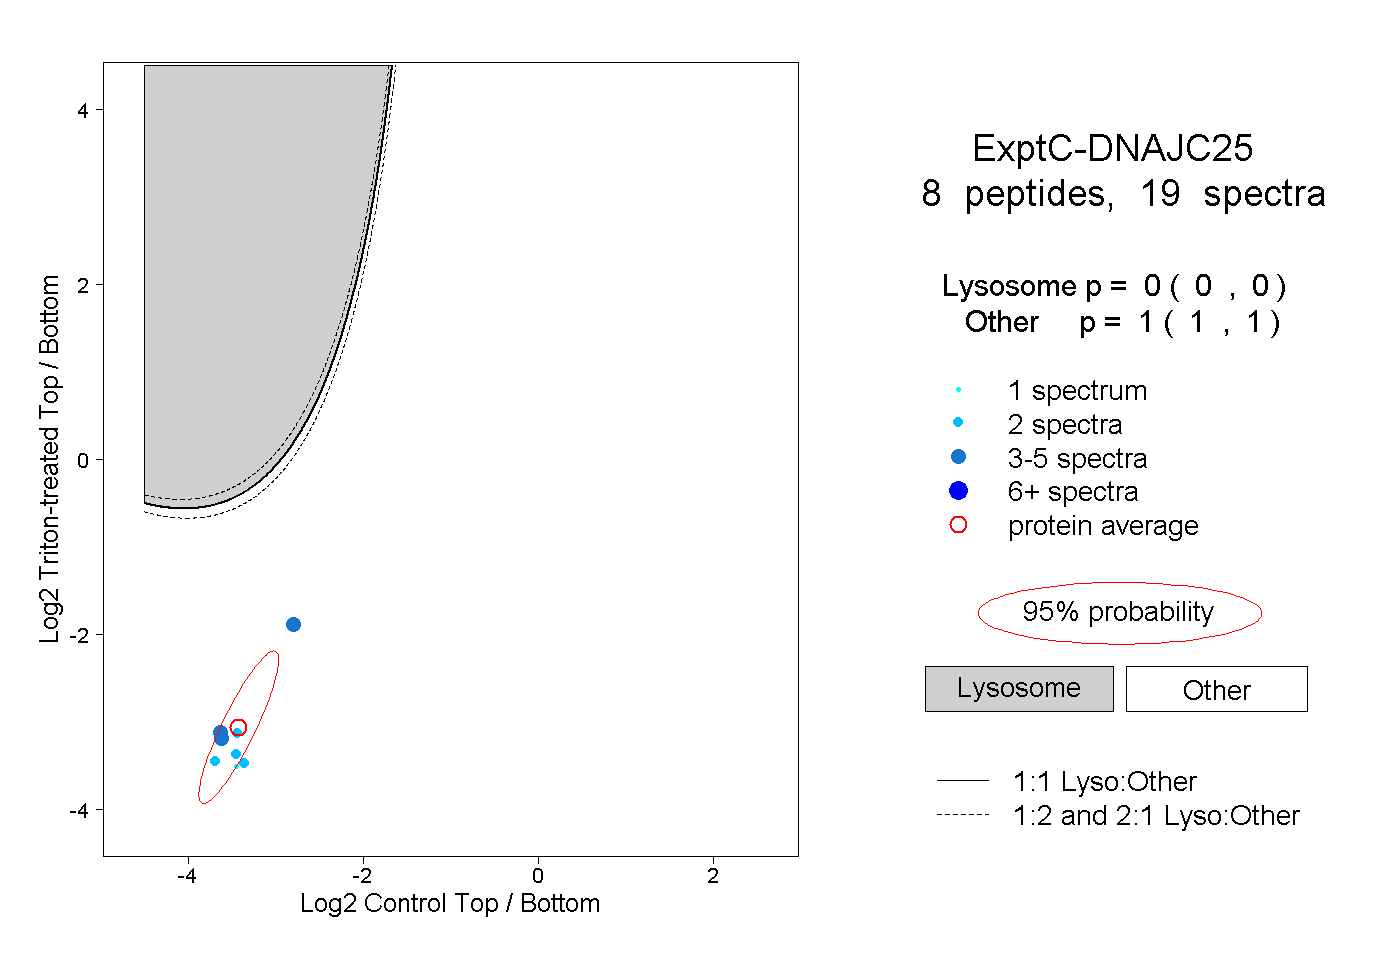
| Expt C |
8
peptides |
19
spectra |
 |
|
0.000
0.000 | 0.000 |
|
|
|
|
|
|
|
1.000
1.000 | 1.000 |
| 3 spectra, LYIIR |
|
0.000 |
|
|
|
|
|
|
|
1.000 |
| 2 spectra, GGYQKPQVR |
|
0.000 |
|
|
|
|
|
|
|
1.000 |
| 2 spectra, EYGEEER |
|
0.000 |
|
|
|
|
|
|
|
1.000 |
| 2 spectra, QEQEEELK |
|
0.000 |
|
|
|
|
|
|
|
1.000 |
| 3 spectra, IQATEIAK |
|
0.000 |
|
|
|
|
|
|
|
1.000 |
| 2 spectra, ENYEVYK |
|
0.000 |
|
|
|
|
|
|
|
1.000 |
| 4 spectra, DCYEVLGVSR |
|
0.000 |
|
|
|
|
|
|
|
1.000 |
| 1 spectrum, AISYLATVPK |
|
0.000 |
|
|
|
|
|
|
|
1.000 |