 2
2peptides
spectra
0.000 | 0.000
0.000 | 0.000
0.000 | 0.000
0.000 | 0.000
0.000 | 0.000
0.000 | 0.000
0.865 | 0.913
0.081 | 0.129
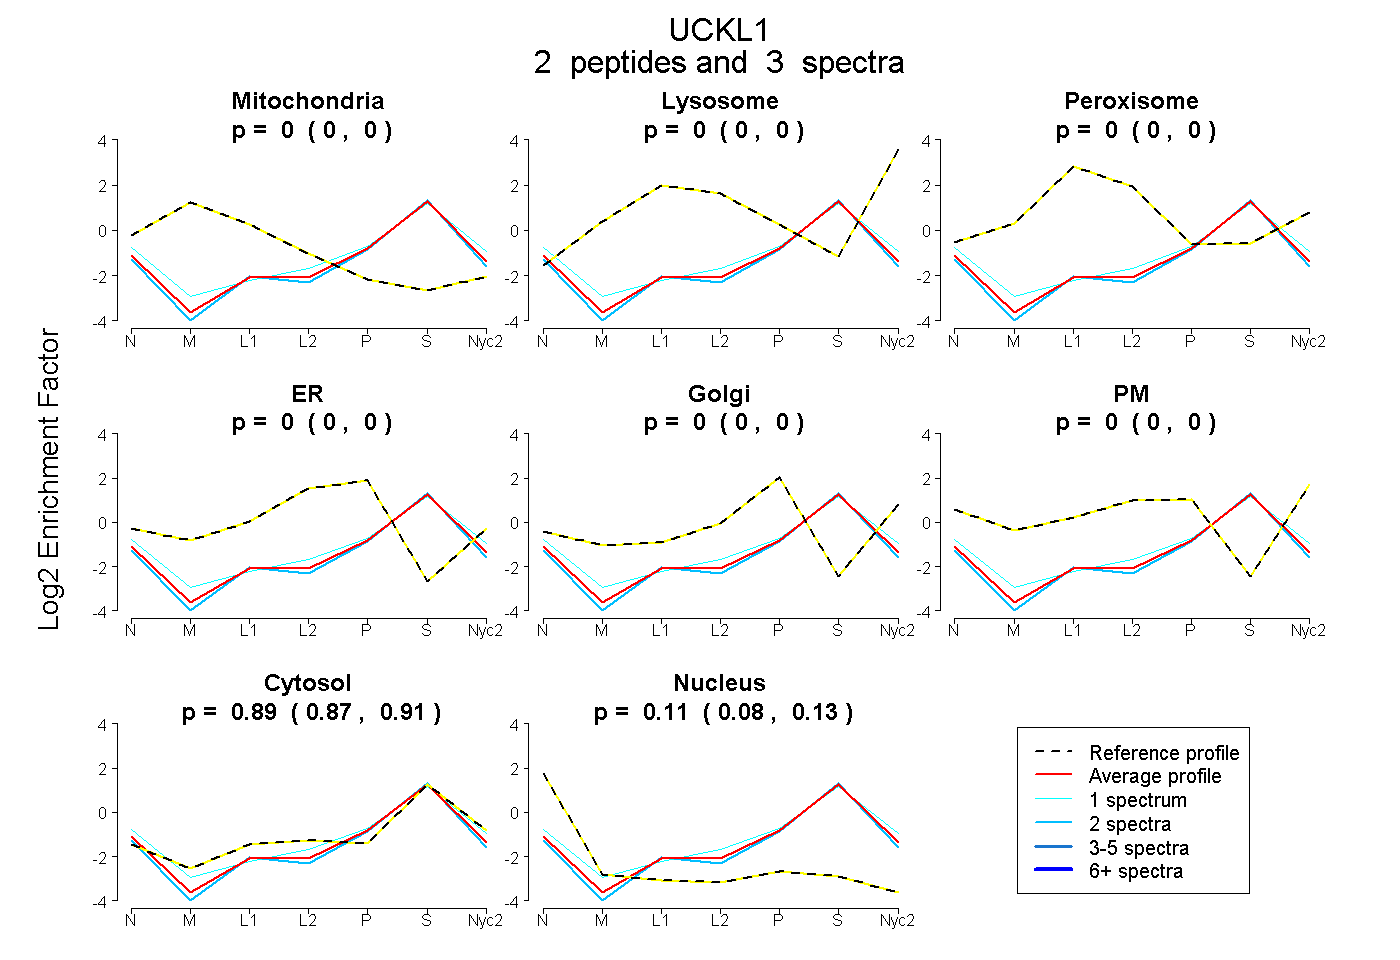
| Plot | Mito | Lyso | Perox | ER | Golgi | PM | Cytosol | Nucleus | |||||
| Expt A |
2 peptides |
3 spectra |
|
0.000 0.000 | 0.000 |
0.000 0.000 | 0.000 |
0.000 0.000 | 0.000 |
0.000 0.000 | 0.000 |
0.000 0.000 | 0.000 |
0.000 0.000 | 0.000 |
0.892 0.865 | 0.913 |
0.108 0.081 | 0.129 |
| 1 spectrum, TLLELLDMK | 0.000 | 0.000 | 0.000 | 0.000 | 0.030 | 0.000 | 0.878 | 0.093 | ||
| 2 spectra, LLPPVGTGR | 0.000 | 0.000 | 0.000 | 0.000 | 0.000 | 0.000 | 0.886 | 0.114 |