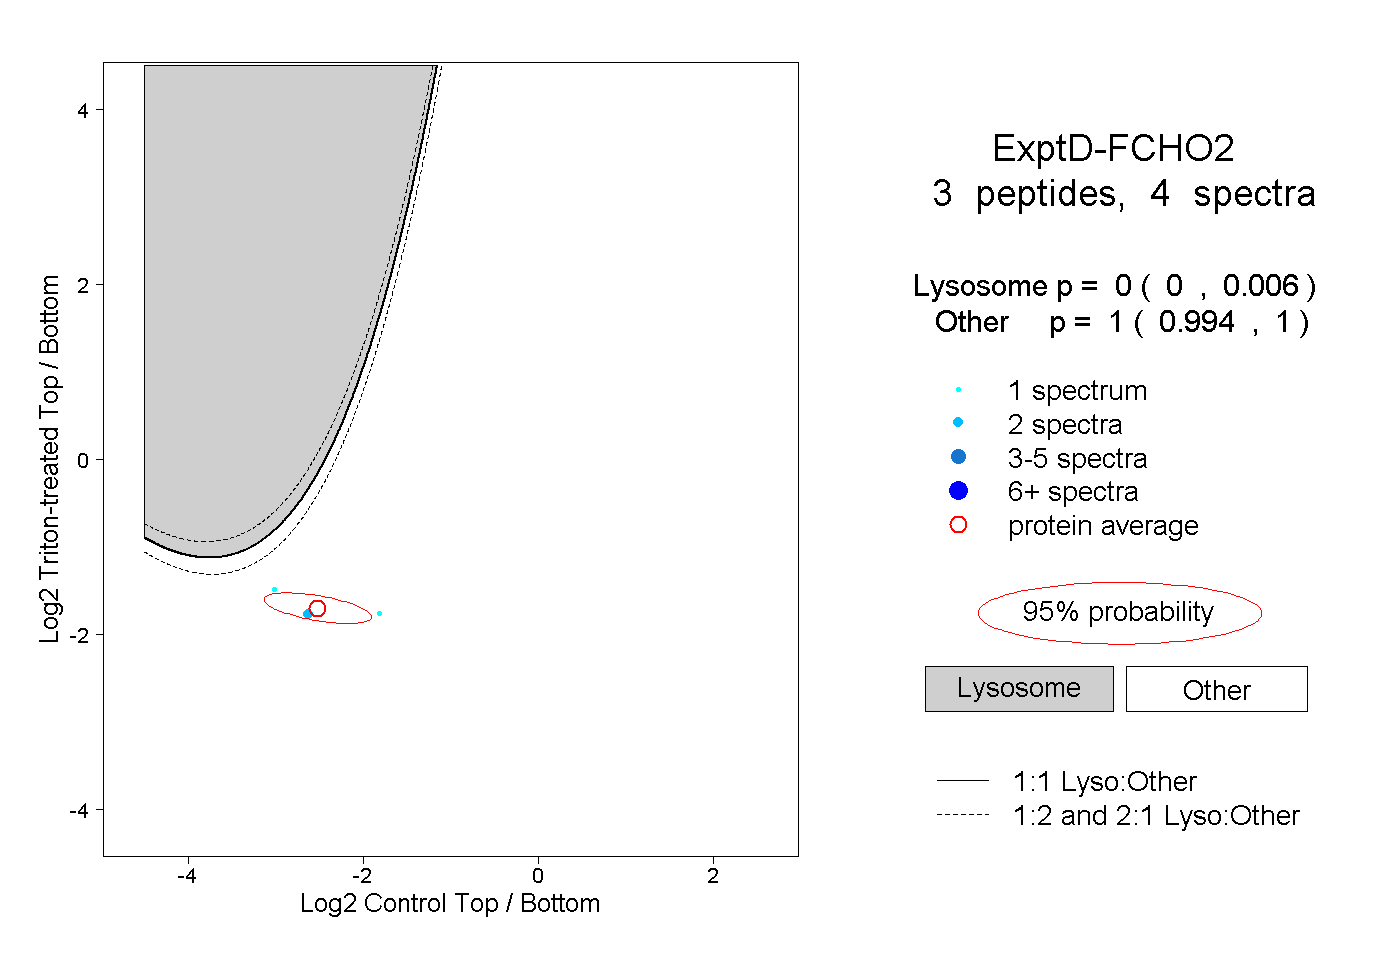
10
10peptides
spectra
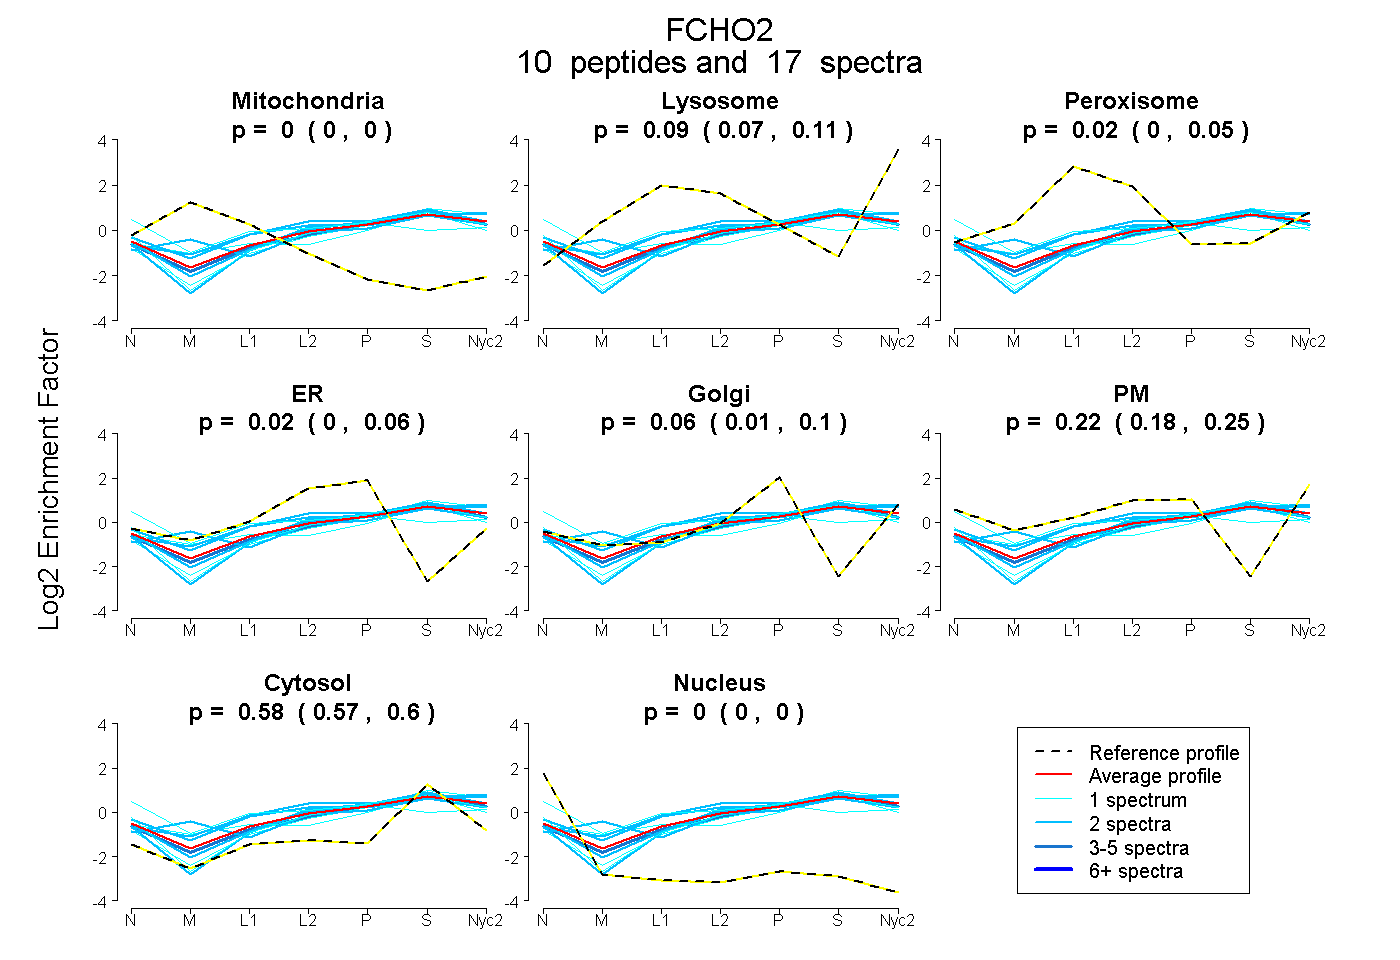
0.000 | 0.000
0.067 | 0.109
0.000 | 0.054
0.000 | 0.055
0.014 | 0.099
0.182 | 0.254
0.566 | 0.595
0.000 | 0.000
2peptides
spectra
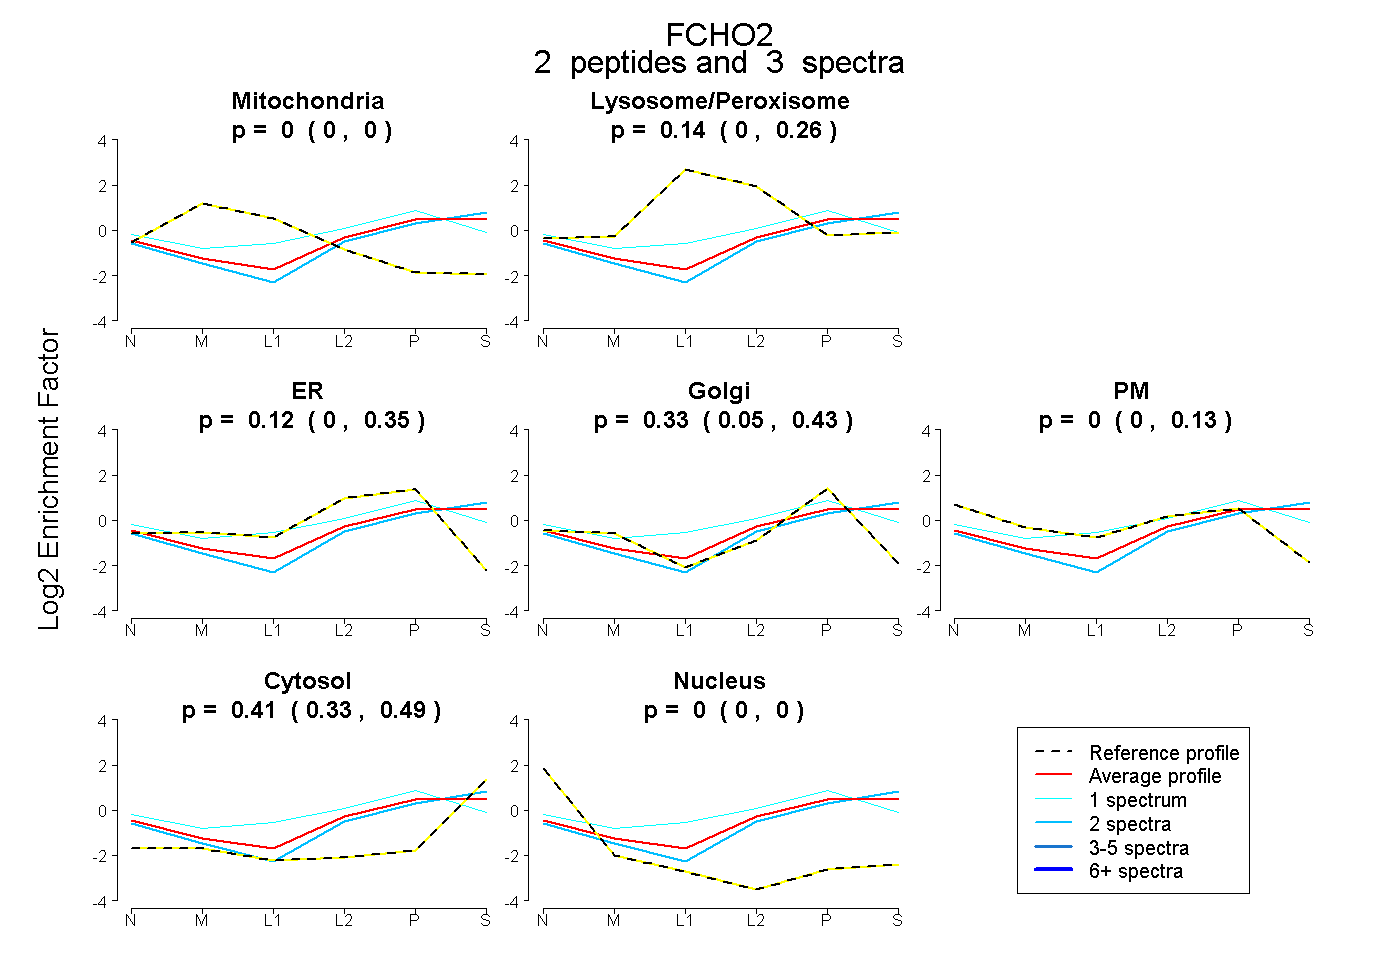
0.000 | 0.000
0.000 | 0.262
0.000 | 0.345
0.051 | 0.432
0.000 | 0.127
0.329 | 0.494
0.000 | 0.000
15peptides
spectra
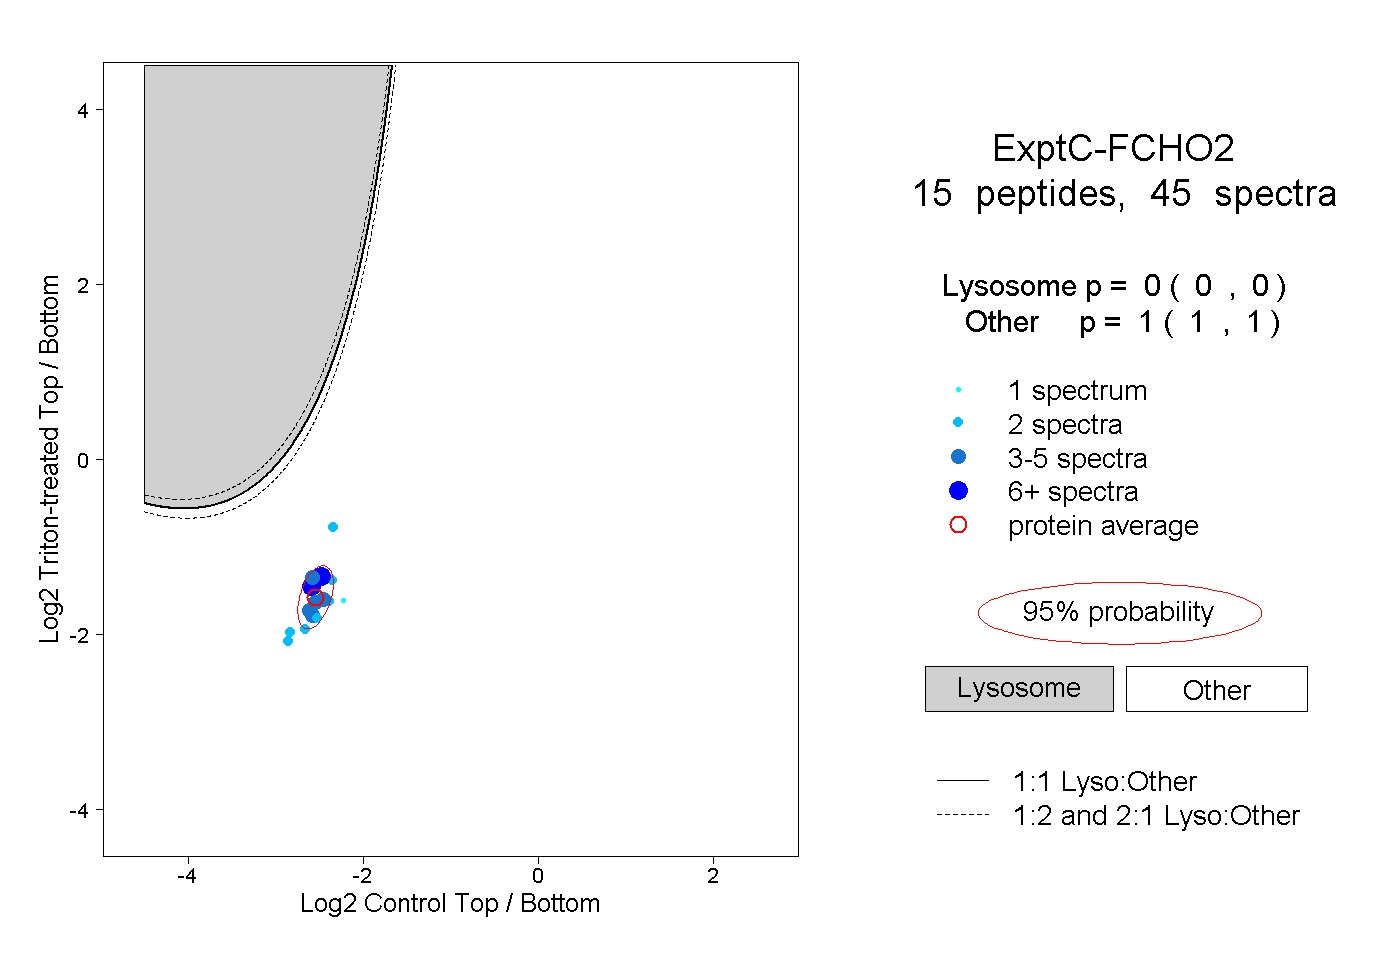
0.000 | 0.000
1.000 | 1.000