 1
1peptide
spectra
0.583 | 0.649
0.248 | 0.294
0.000 | 0.000
0.000 | 0.000
0.000 | 0.000
0.046 | 0.155
0.000 | 0.000
0.000 | 0.000
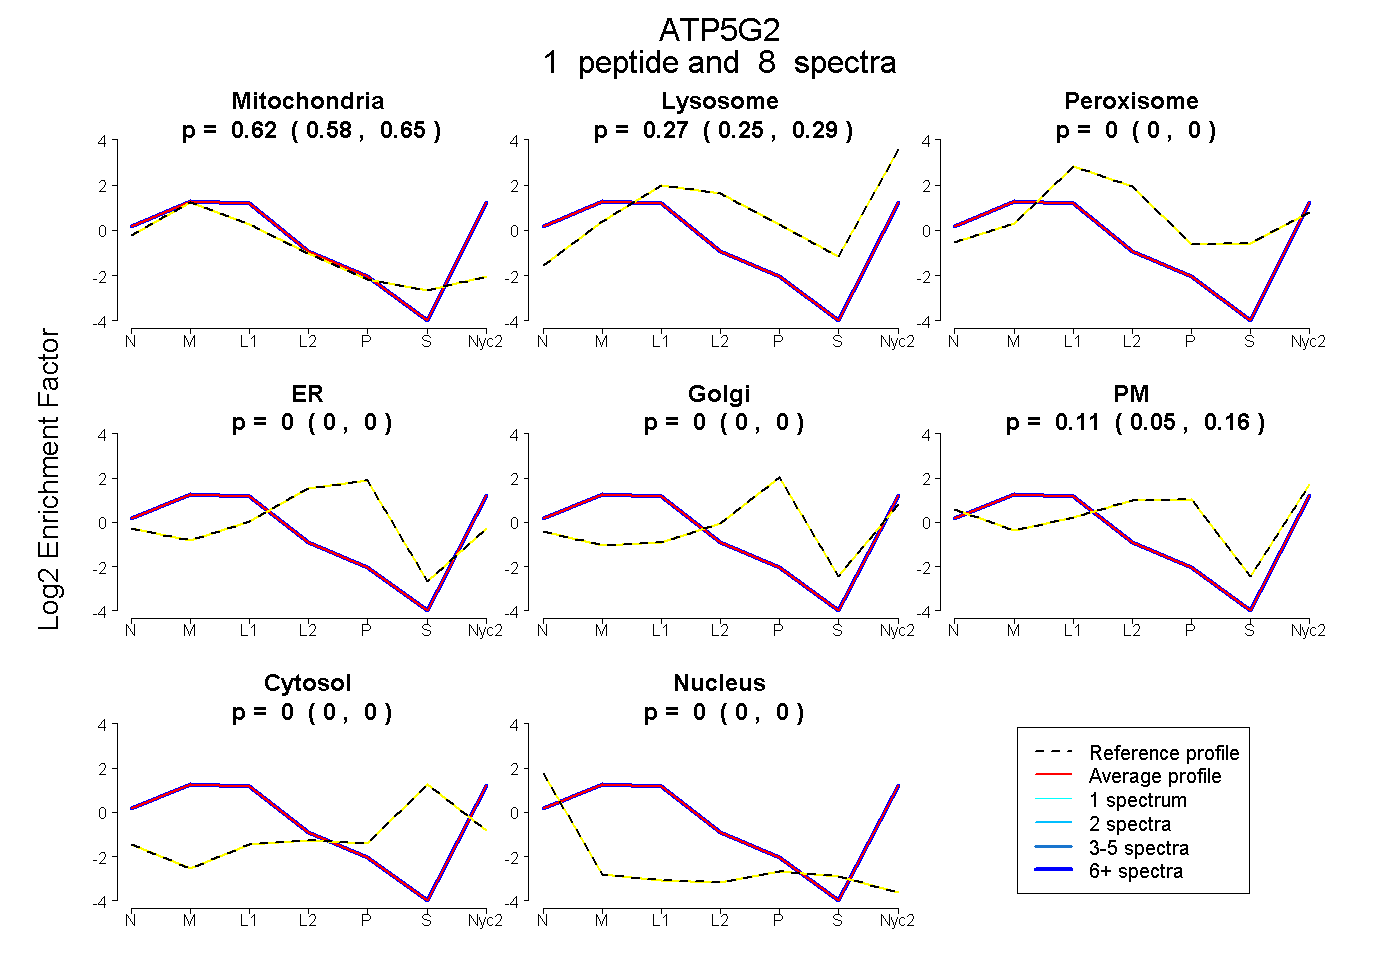
| Plot | Mito | Lyso | Perox | ER | Golgi | PM | Cytosol | Nucleus | |||||
| Expt A |
1 peptide |
8 spectra |
|
0.620 0.583 | 0.649 |
0.272 0.248 | 0.294 |
0.000 0.000 | 0.000 |
0.000 0.000 | 0.000 |
0.000 0.000 | 0.000 |
0.107 0.046 | 0.155 |
0.000 0.000 | 0.000 |
0.000 0.000 | 0.000 |