 3
3peptides
spectra
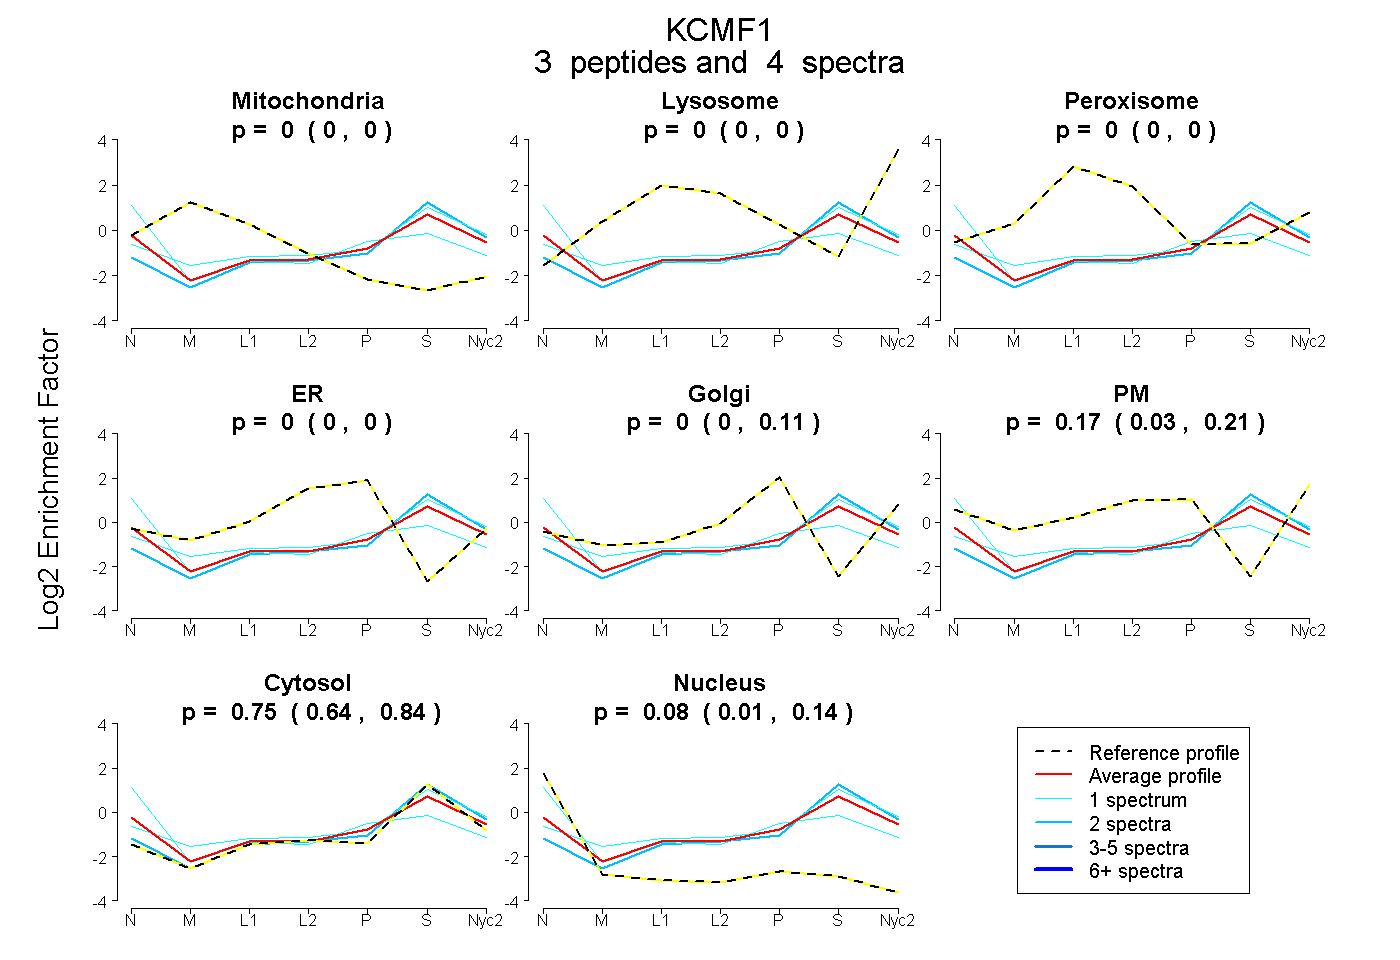
0.000 | 0.000
0.000 | 0.000
0.000 | 0.000
0.000 | 0.000
0.000 | 0.112
0.025 | 0.206
0.644 | 0.836
0.013 | 0.141
| Plot | Mito | Lyso | Perox | ER | Golgi | PM | Cytosol | Nucleus | |||||
| Expt A |
3 peptides |
4 spectra |
|
0.000 0.000 | 0.000 |
0.000 0.000 | 0.000 |
0.000 0.000 | 0.000 |
0.000 0.000 | 0.000 |
0.000 0.000 | 0.112 |
0.166 0.025 | 0.206 |
0.751 0.644 | 0.836 |
0.084 0.013 | 0.141 |
| 1 spectrum, MSEAER | 0.016 | 0.013 | 0.002 | 0.000 | 0.000 | 0.173 | 0.796 | 0.000 | ||
| 2 spectra, DLDESSGVR | 0.000 | 0.021 | 0.000 | 0.000 | 0.049 | 0.000 | 0.929 | 0.000 | ||
| 1 spectrum, QQLETAR | 0.000 | 0.000 | 0.000 | 0.000 | 0.000 | 0.254 | 0.454 | 0.292 |
| Plot | Mito | Lyso or Perox | ER | Golgi | PM | Cytosol | Nucleus | ||||||
| Expt B |
1 peptide |
1 spectrum |
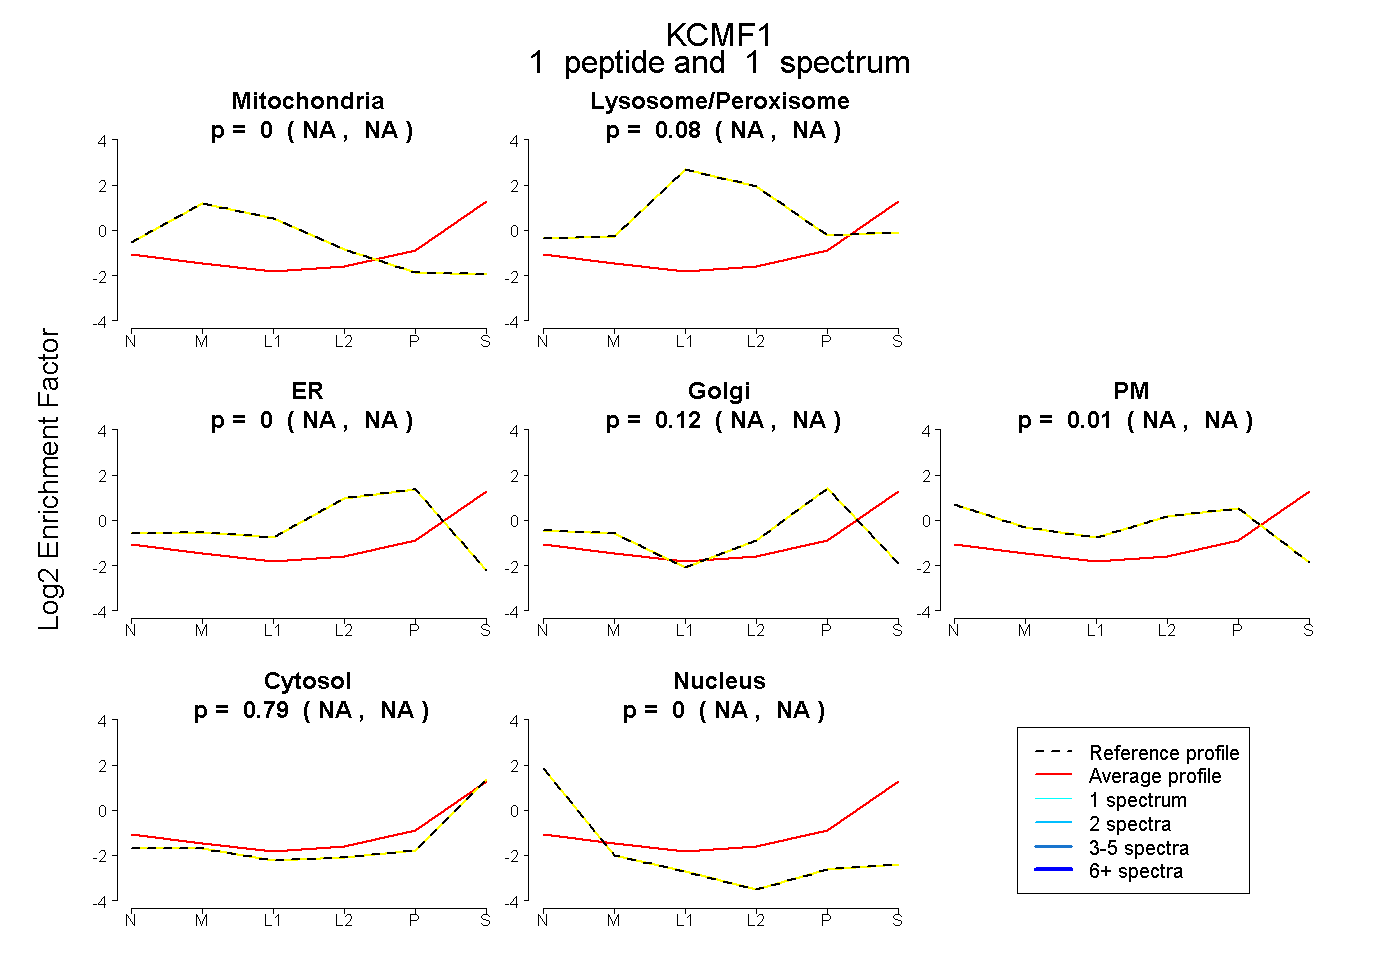 |
0.000 NA | NA |
0.084 NA | NA |
0.000 NA | NA |
0.116 NA | NA |
0.014 NA | NA |
0.786 NA | NA |
0.000 NA | NA |
|||
| Plot | Lyso | Other | |||||||||||
| Expt C |
1 peptide |
3 spectra |
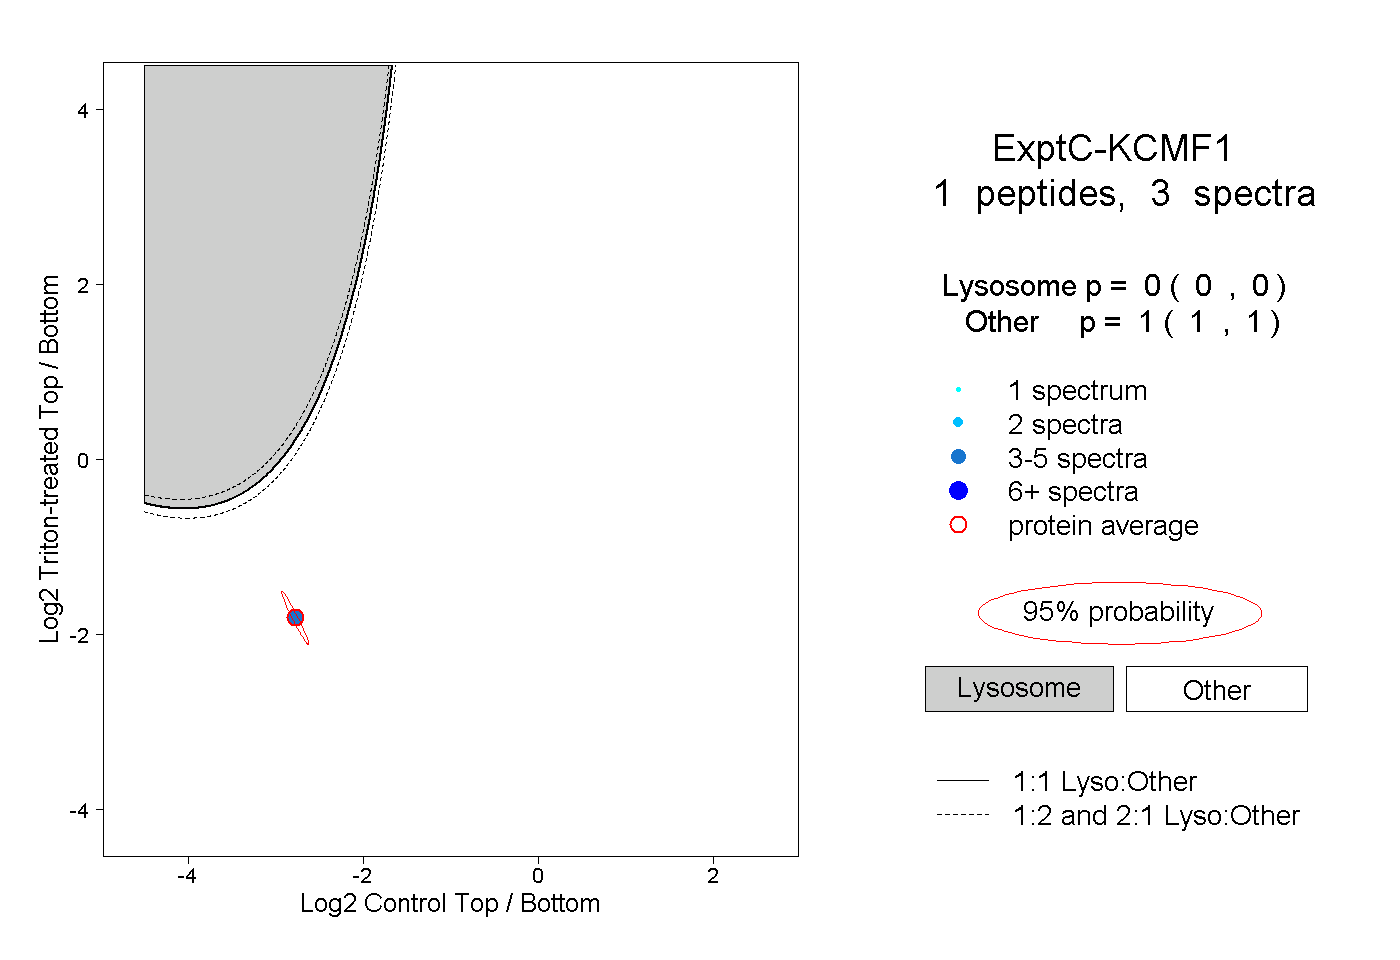 |
0.000 0.000 | 0.000 |
1.000 1.000 | 1.000 |