 3
3peptides
spectra
0.863 | 0.886
0.000 | 0.000
0.000 | 0.000
0.017 | 0.078
0.000 | 0.010
0.038 | 0.104
0.000 | 0.000
0.000 | 0.002
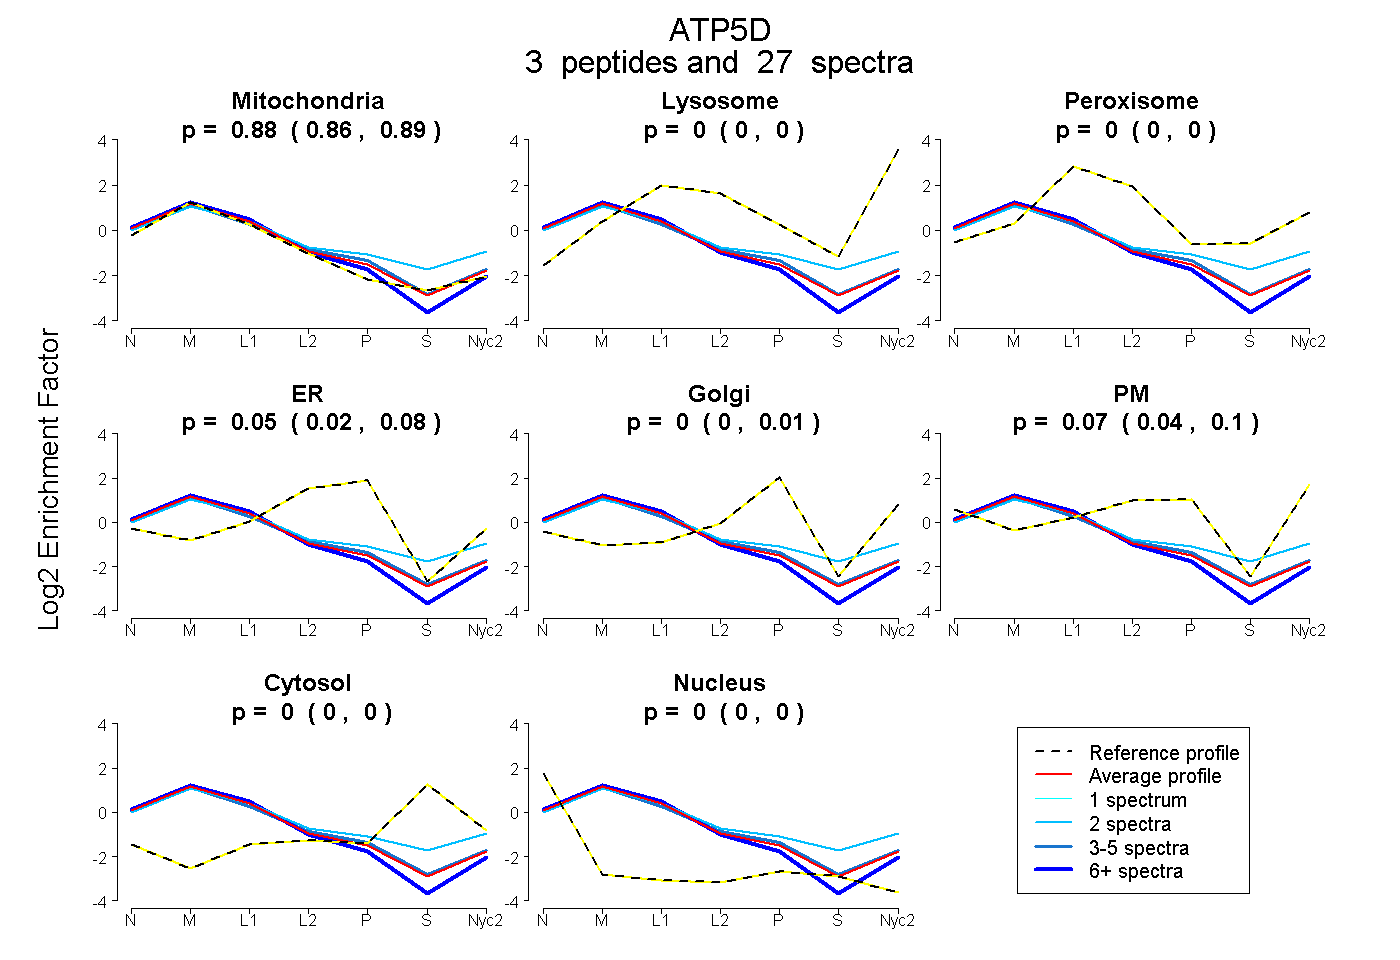
| Plot | Mito | Lyso | Perox | ER | Golgi | PM | Cytosol | Nucleus | |||||
| Expt A |
3 peptides |
27 spectra |
|
0.876 0.863 | 0.886 |
0.000 0.000 | 0.000 |
0.000 0.000 | 0.000 |
0.053 0.017 | 0.078 |
0.000 0.000 | 0.010 |
0.071 0.038 | 0.104 |
0.000 0.000 | 0.000 |
0.000 0.000 | 0.002 |
| 5 spectra, AEIQIR | 0.844 | 0.000 | 0.000 | 0.076 | 0.041 | 0.039 | 0.000 | 0.000 | ||
| 2 spectra, IEANEALVK | 0.660 | 0.017 | 0.096 | 0.000 | 0.041 | 0.126 | 0.059 | 0.000 | ||
| 20 spectra, AQSELSGAADEAAR | 0.933 | 0.000 | 0.000 | 0.061 | 0.000 | 0.000 | 0.000 | 0.006 |
| Plot | Mito | Lyso or Perox | ER | Golgi | PM | Cytosol | Nucleus | ||||||
| Expt B |
3 peptides |
13 spectra |
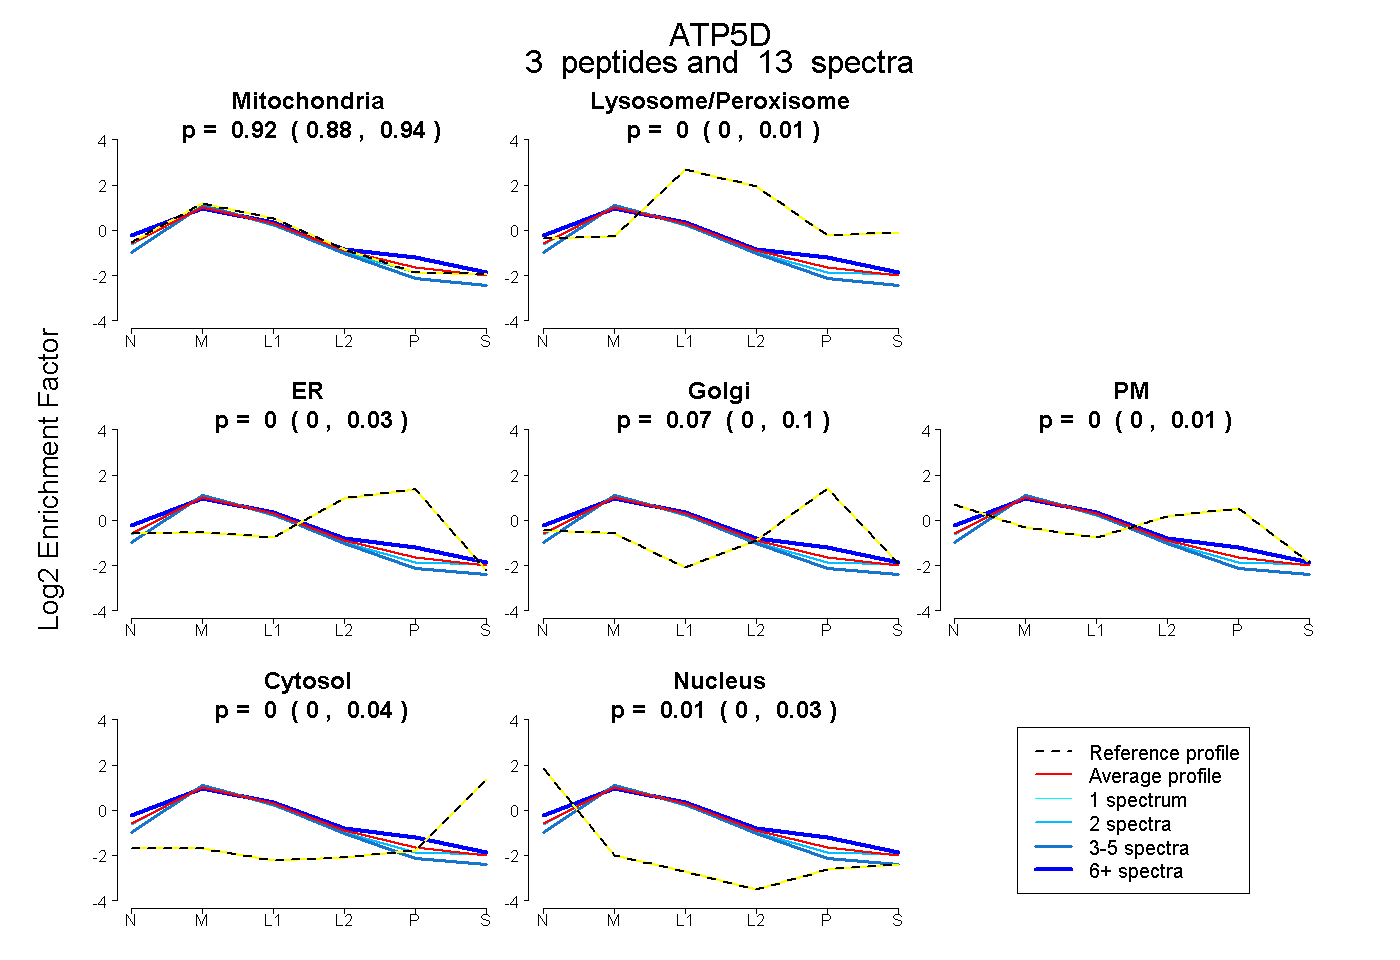 |
0.918 0.878 | 0.935 |
0.000 0.000 | 0.010 |
0.000 0.000 | 0.030 |
0.074 0.000 | 0.099 |
0.000 0.000 | 0.007 |
0.000 0.000 | 0.039 |
0.008 0.000 | 0.031 |
|||
| Plot | Lyso | Other | |||||||||||
| Expt C |
3 peptides |
169 spectra |
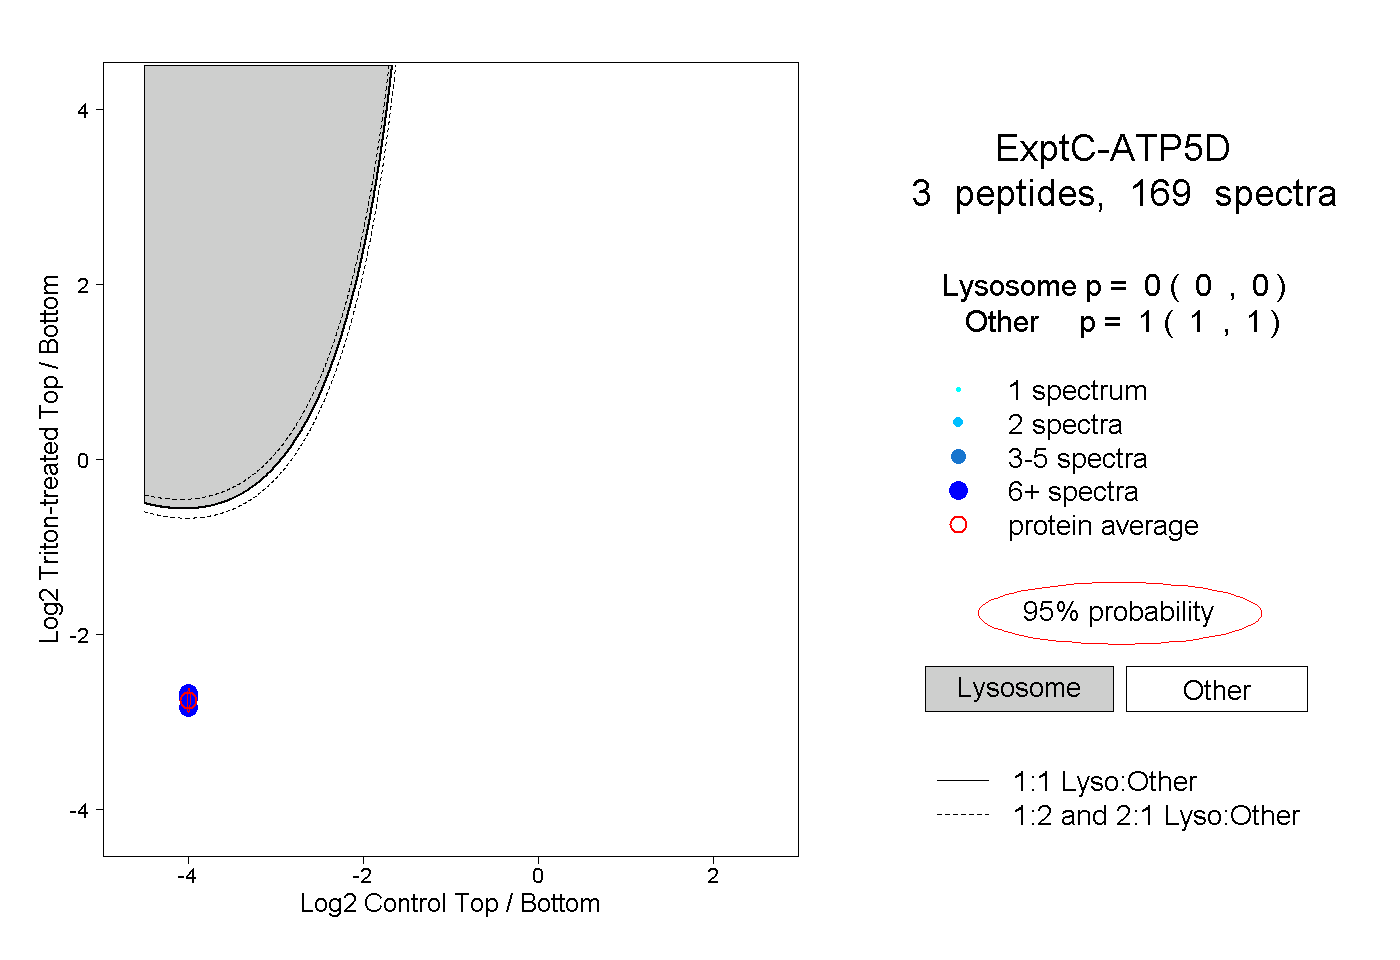 |
0.000 0.000 | 0.000 |
1.000 1.000 | 1.000 |
||||||||
| Plot | Lyso | Other | |||||||||||
| Expt D |
3 peptides |
15 spectra |
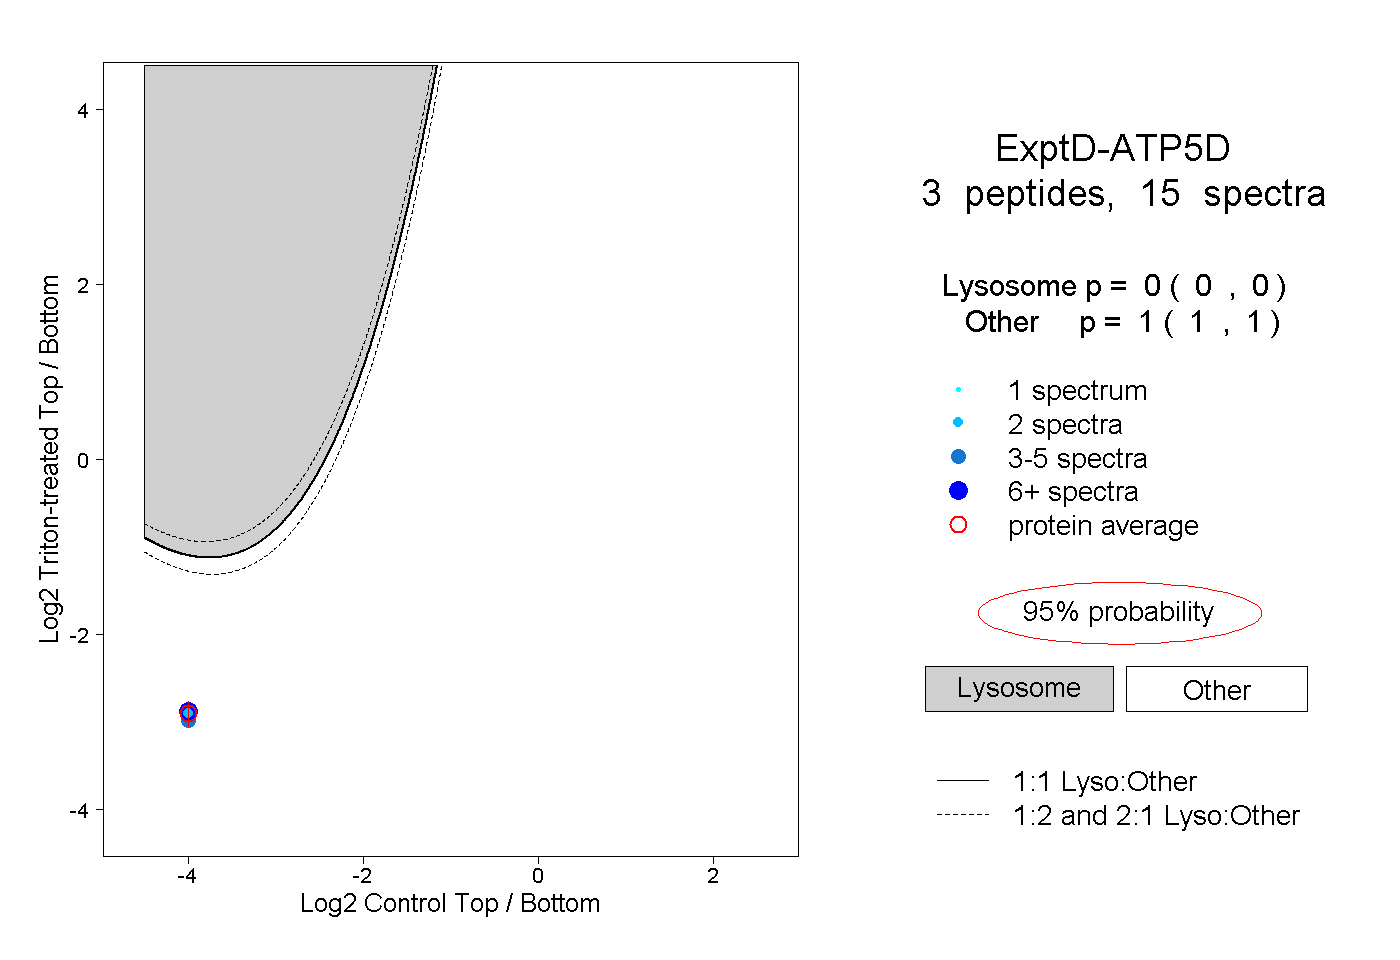 |
0.000 0.000 | 0.000 |
1.000 1.000 | 1.000 |