 3
3peptides
spectra
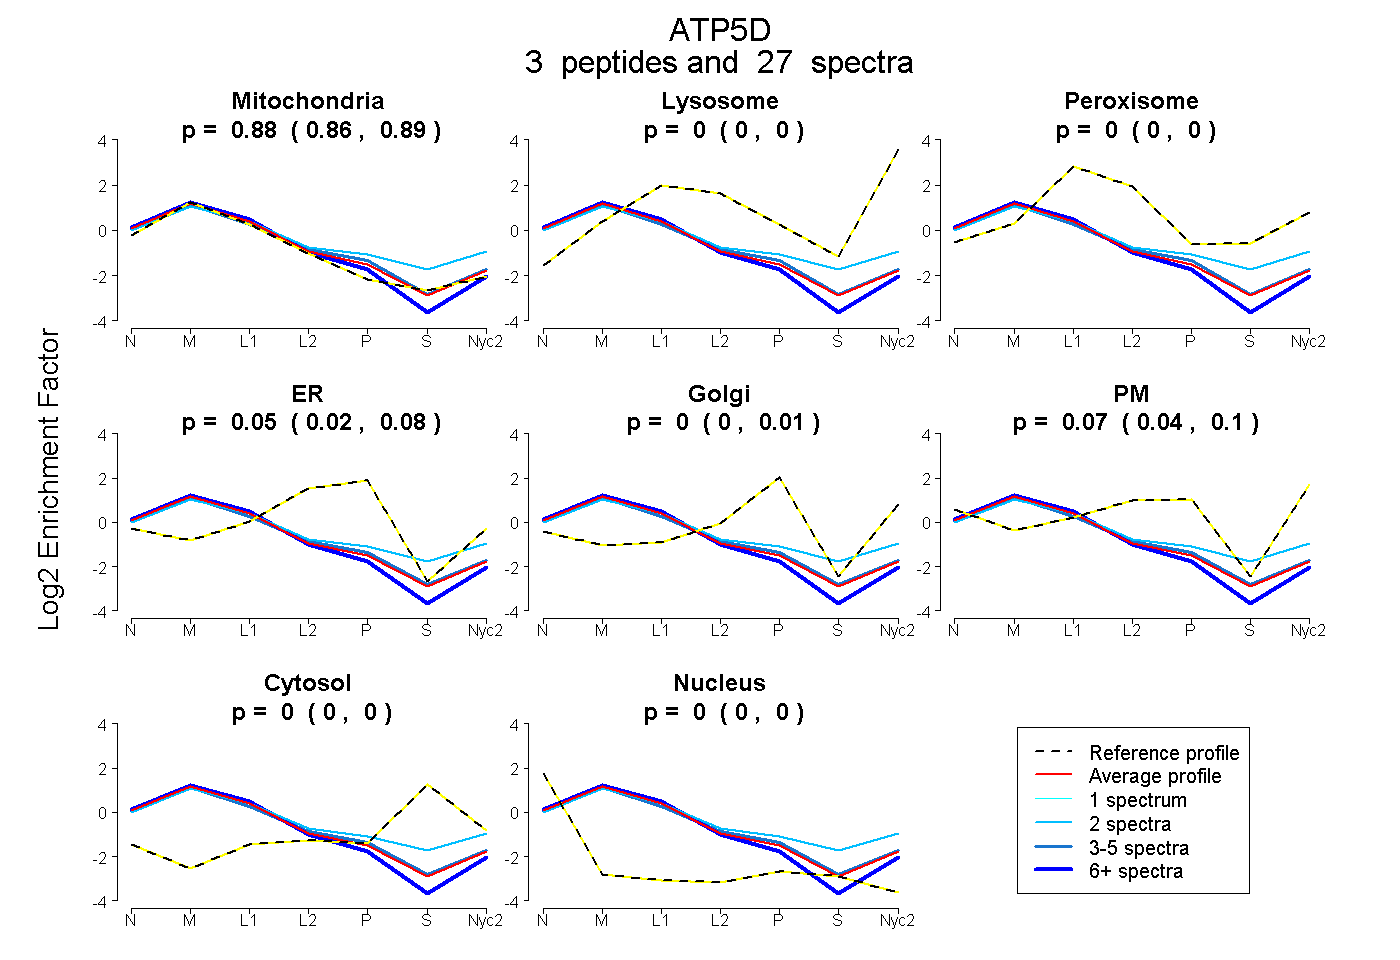
0.863 | 0.886
0.000 | 0.000
0.000 | 0.000
0.017 | 0.078
0.000 | 0.010
0.038 | 0.104
0.000 | 0.000
0.000 | 0.002
3peptides
spectra
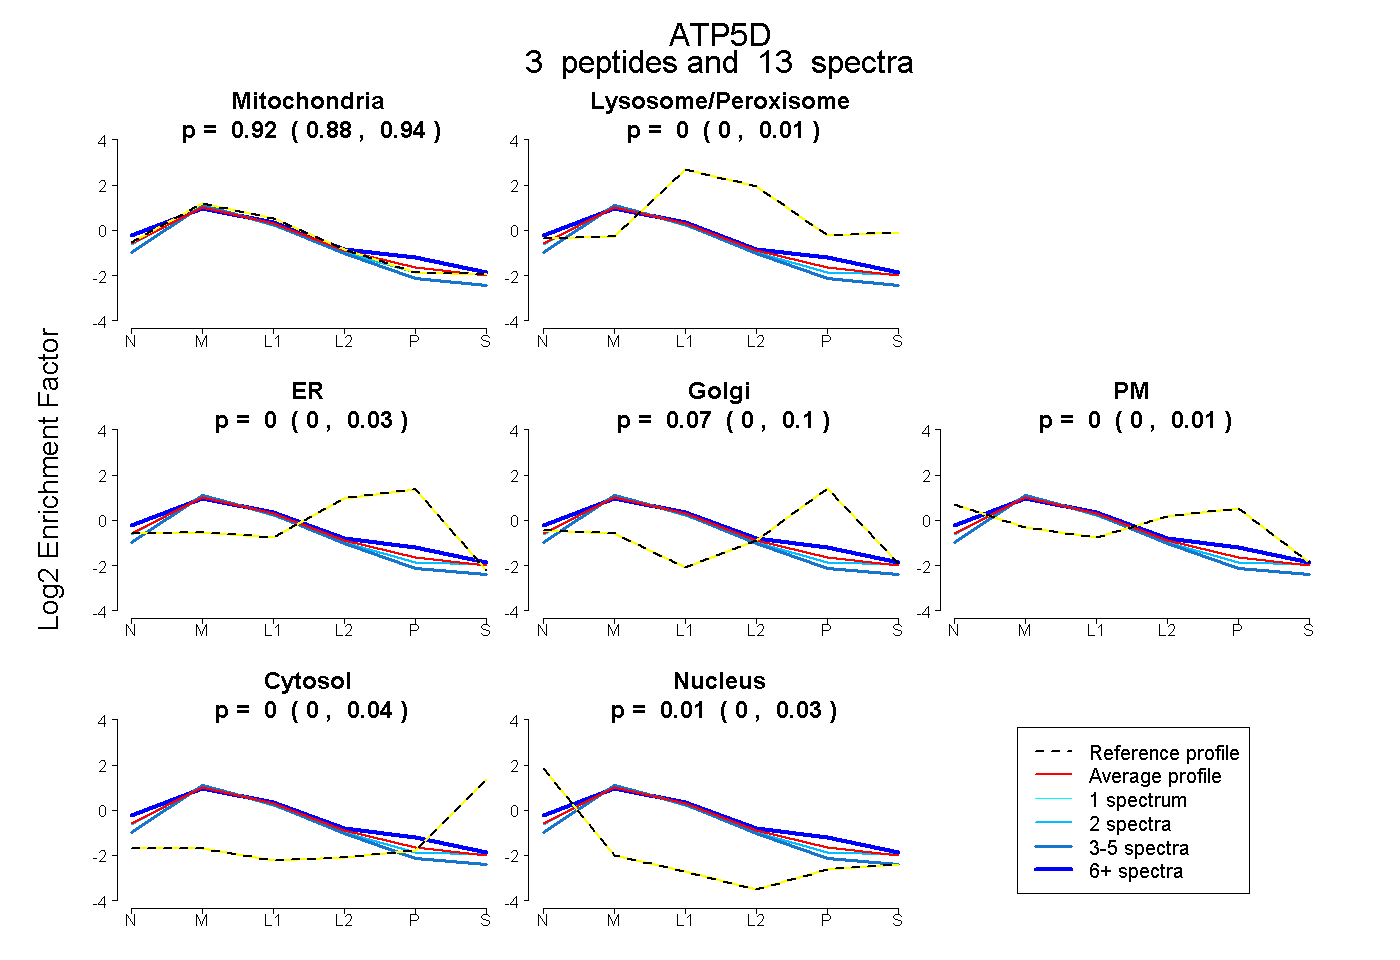
0.878 | 0.935
0.000 | 0.010
0.000 | 0.030
0.000 | 0.099
0.000 | 0.007
0.000 | 0.039
0.000 | 0.031
3peptides
spectra
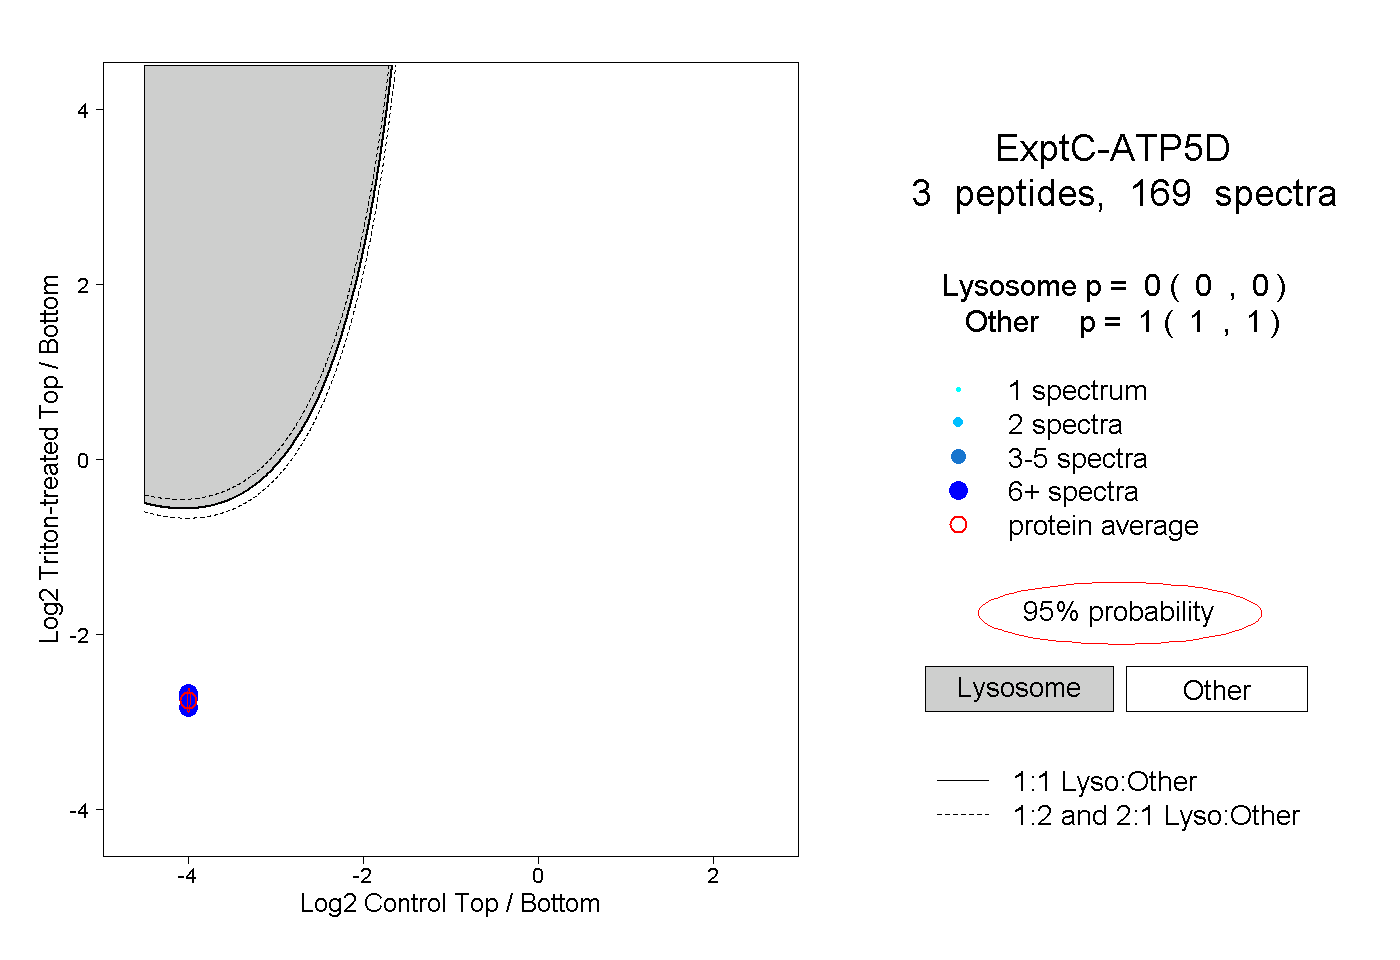
0.000 | 0.000
1.000 | 1.000
3peptides
spectra
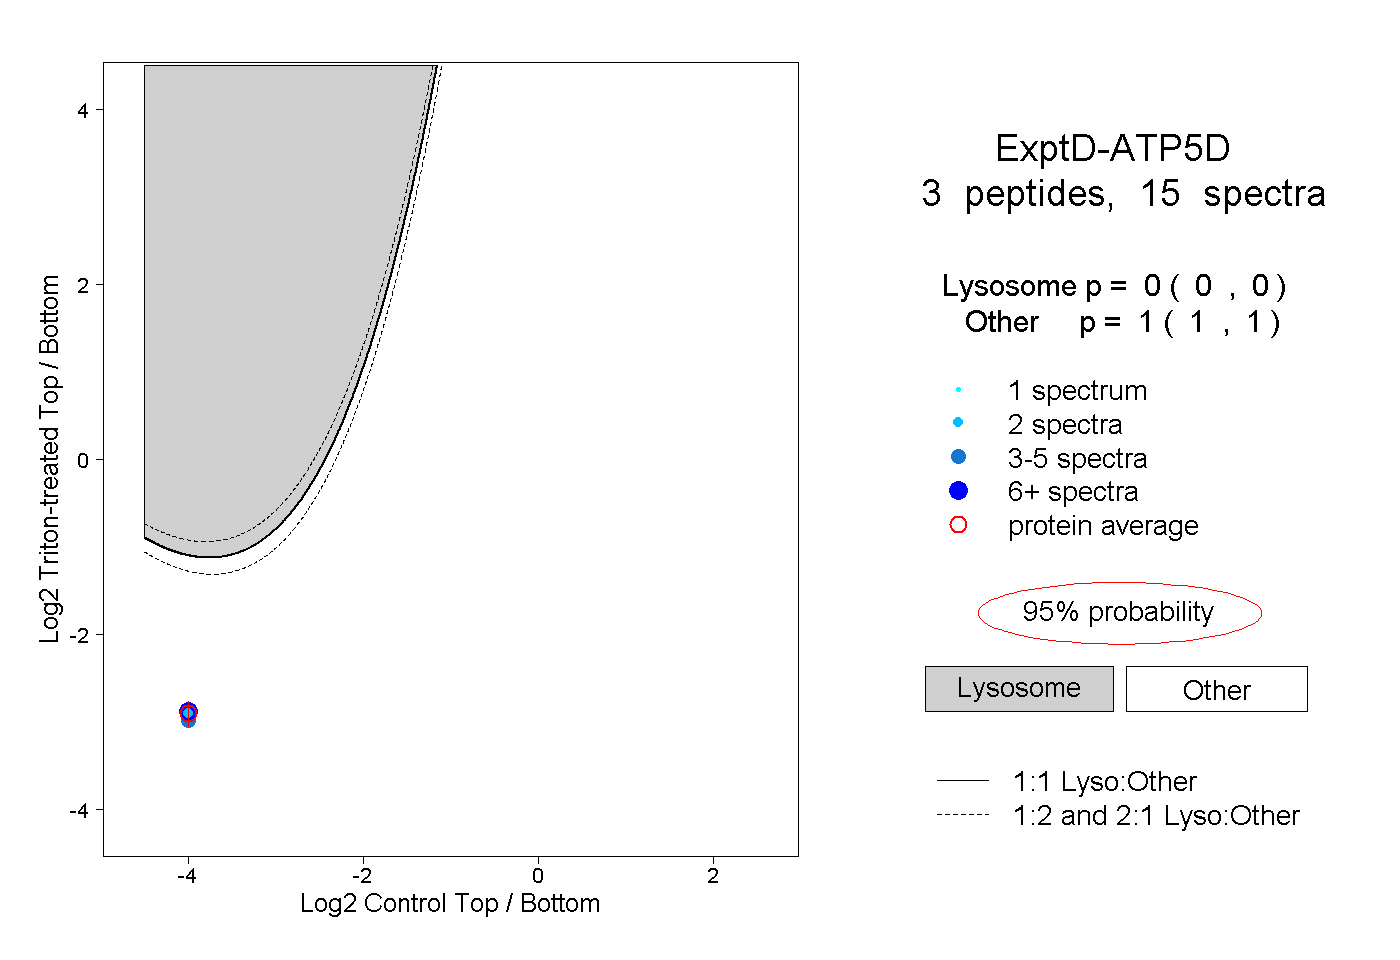
0.000 | 0.000
1.000 | 1.000