10
10peptides
spectra
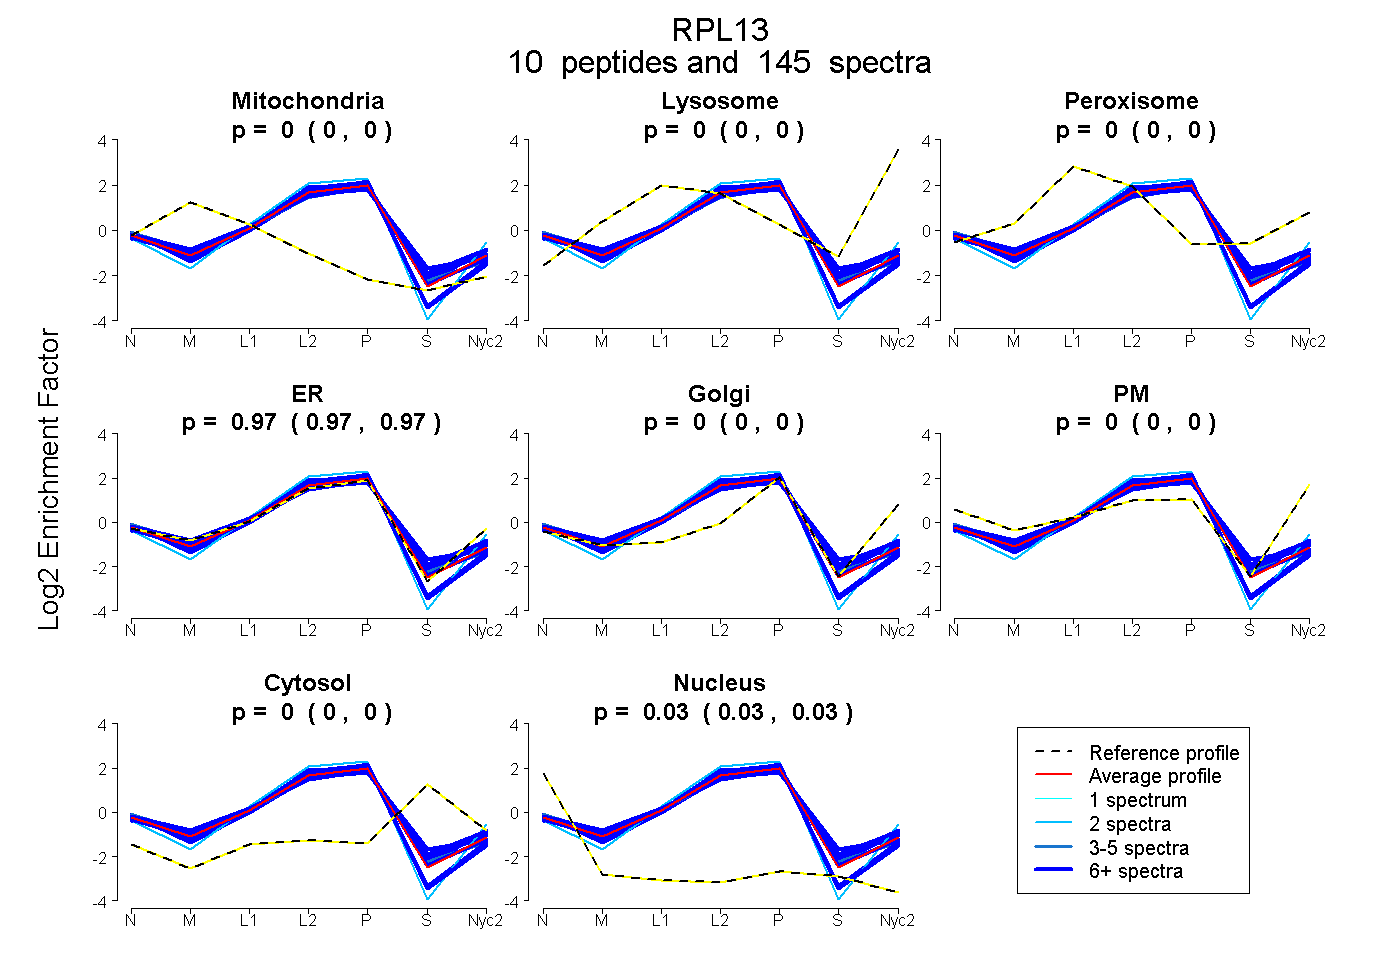
0.000 | 0.000
0.000 | 0.000
0.000 | 0.000
0.965 | 0.967
0.000 | 0.000
0.000 | 0.000
0.000 | 0.000
0.033 | 0.034
10peptides
spectra
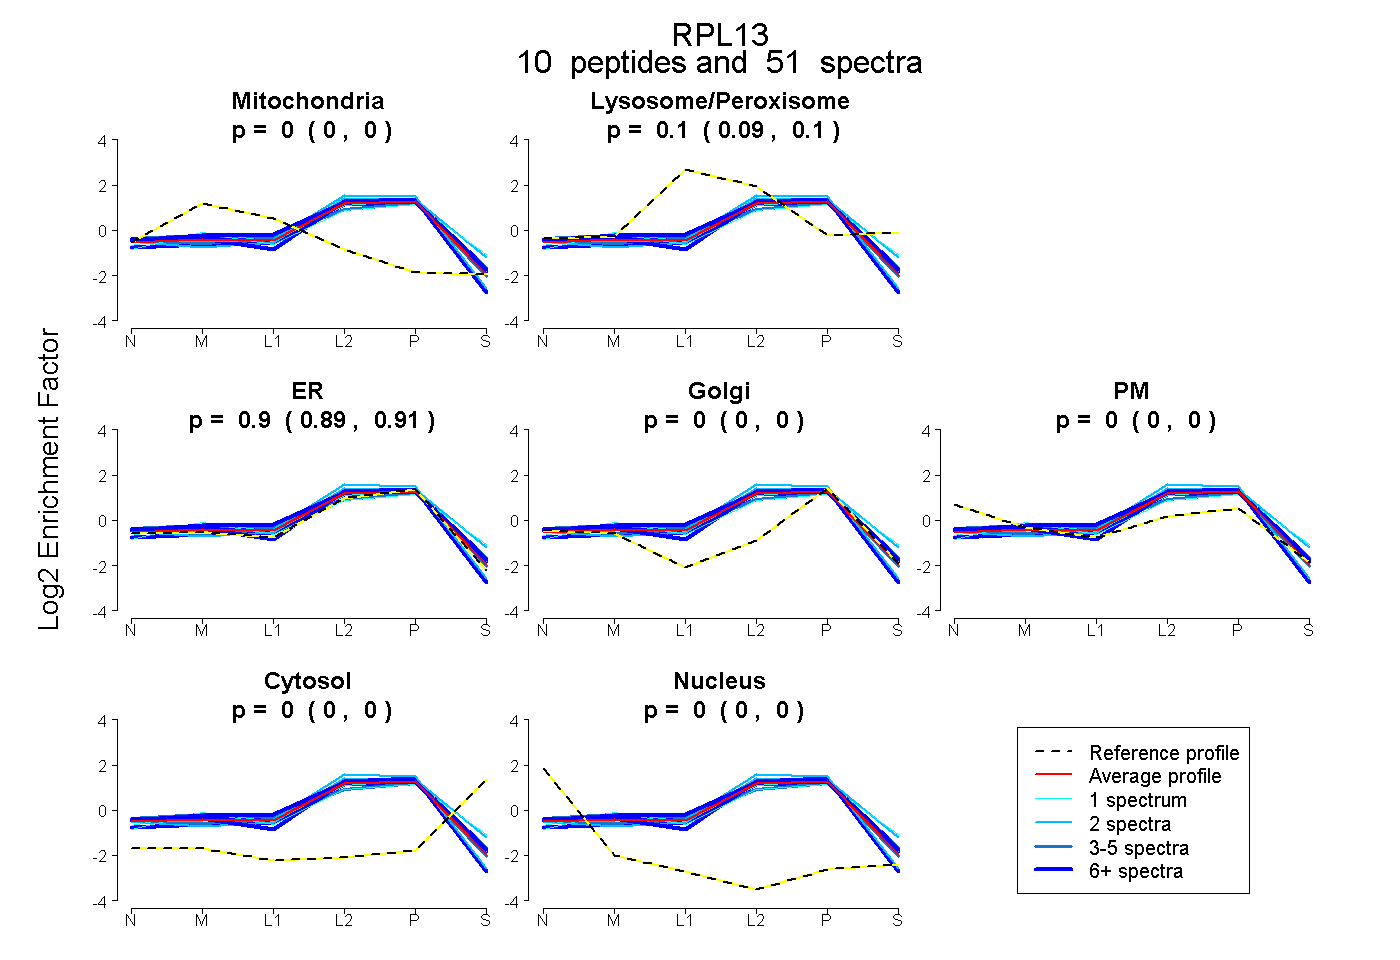
0.000 | 0.000
0.092 | 0.104
0.895 | 0.907
0.000 | 0.000
0.000 | 0.000
0.000 | 0.000
0.000 | 0.000