 10
10peptides
spectra
0.000 | 0.000
0.000 | 0.000
0.000 | 0.000
0.965 | 0.967
0.000 | 0.000
0.000 | 0.000
0.000 | 0.000
0.033 | 0.034
| Plot | Mito | Lyso | Perox | ER | Golgi | PM | Cytosol | Nucleus | |||||
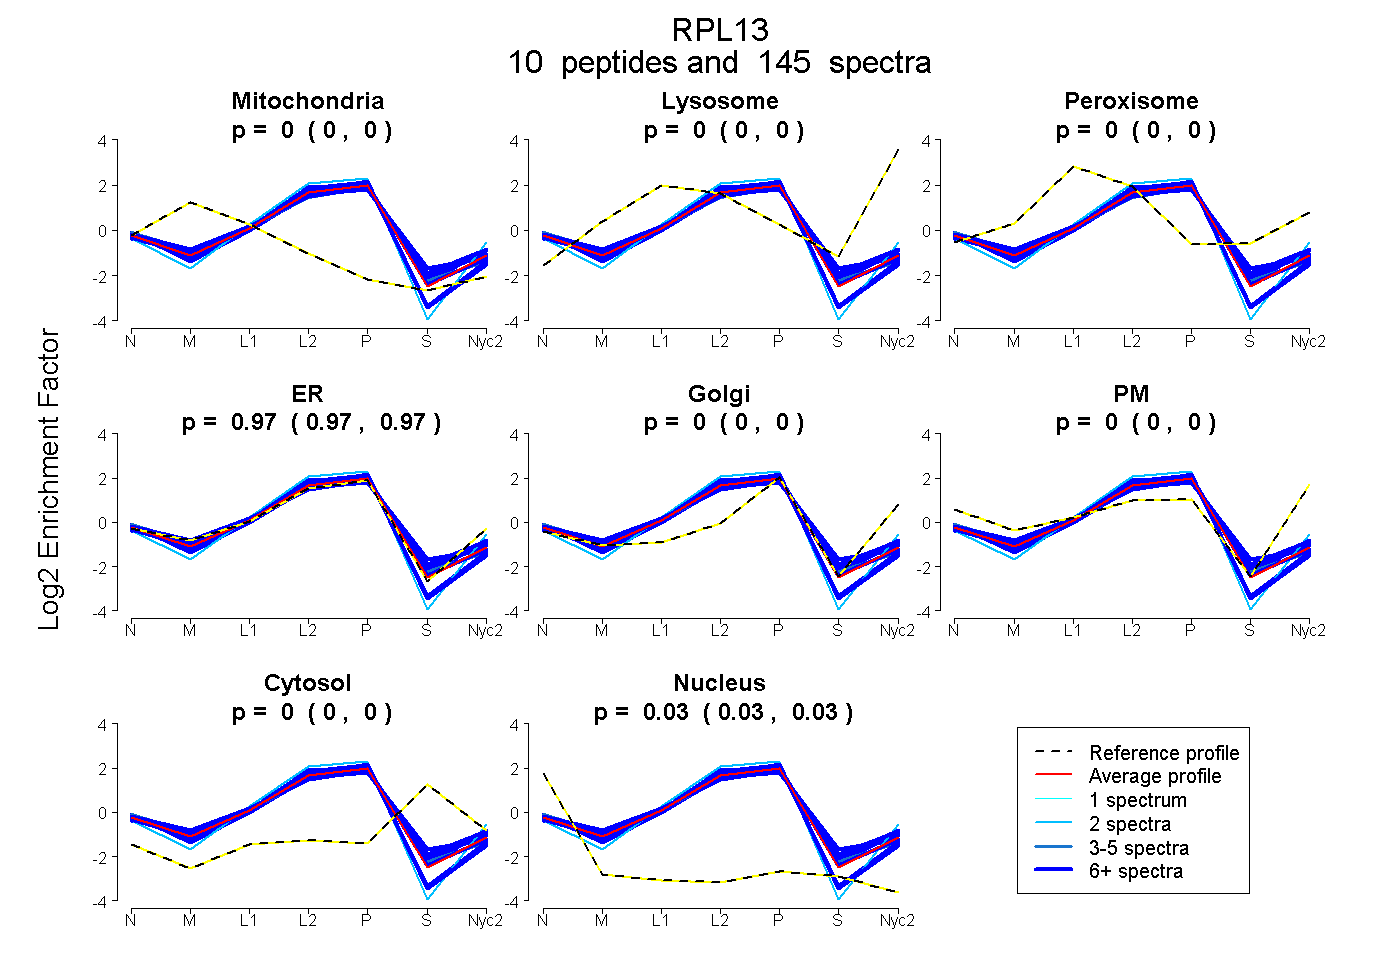
| Expt A |
10 peptides |
145 spectra |
|
0.000 0.000 | 0.000 |
0.000 0.000 | 0.000 |
0.000 0.000 | 0.000 |
0.966 0.965 | 0.967 |
0.000 0.000 | 0.000 |
0.000 0.000 | 0.000 |
0.000 0.000 | 0.000 |
0.034 0.033 | 0.034 |
| 5 spectra, KPSAPK | 0.001 | 0.000 | 0.000 | 0.935 | 0.000 | 0.000 | 0.011 | 0.053 | ||
| 39 spectra, STESLQANVQR | 0.000 | 0.000 | 0.000 | 0.956 | 0.000 | 0.000 | 0.000 | 0.044 | ||
| 32 spectra, VAGIHK | 0.000 | 0.000 | 0.019 | 0.924 | 0.000 | 0.000 | 0.056 | 0.001 | ||
| 17 spectra, LATQLTGPVMPIR | 0.000 | 0.000 | 0.000 | 0.977 | 0.000 | 0.000 | 0.000 | 0.023 | ||
| 13 spectra, AFASLR | 0.000 | 0.000 | 0.000 | 0.956 | 0.000 | 0.000 | 0.044 | 0.000 | ||
| 12 spectra, VDTWFNQPAR | 0.000 | 0.000 | 0.000 | 0.978 | 0.000 | 0.000 | 0.001 | 0.021 | ||
| 2 spectra, NGMILKPHFHK | 0.000 | 0.000 | 0.000 | 1.000 | 0.000 | 0.000 | 0.000 | 0.000 | ||
| 6 spectra, EAAEQDVEK | 0.000 | 0.000 | 0.000 | 0.866 | 0.000 | 0.000 | 0.128 | 0.006 | ||
| 12 spectra, GFSLEELR | 0.000 | 0.000 | 0.000 | 0.913 | 0.000 | 0.000 | 0.087 | 0.000 | ||
| 7 spectra, AITEEEK | 0.000 | 0.000 | 0.000 | 0.917 | 0.000 | 0.000 | 0.068 | 0.015 |
| Plot | Mito | Lyso or Perox | ER | Golgi | PM | Cytosol | Nucleus | ||||||
| Expt B |
10 peptides |
51 spectra |
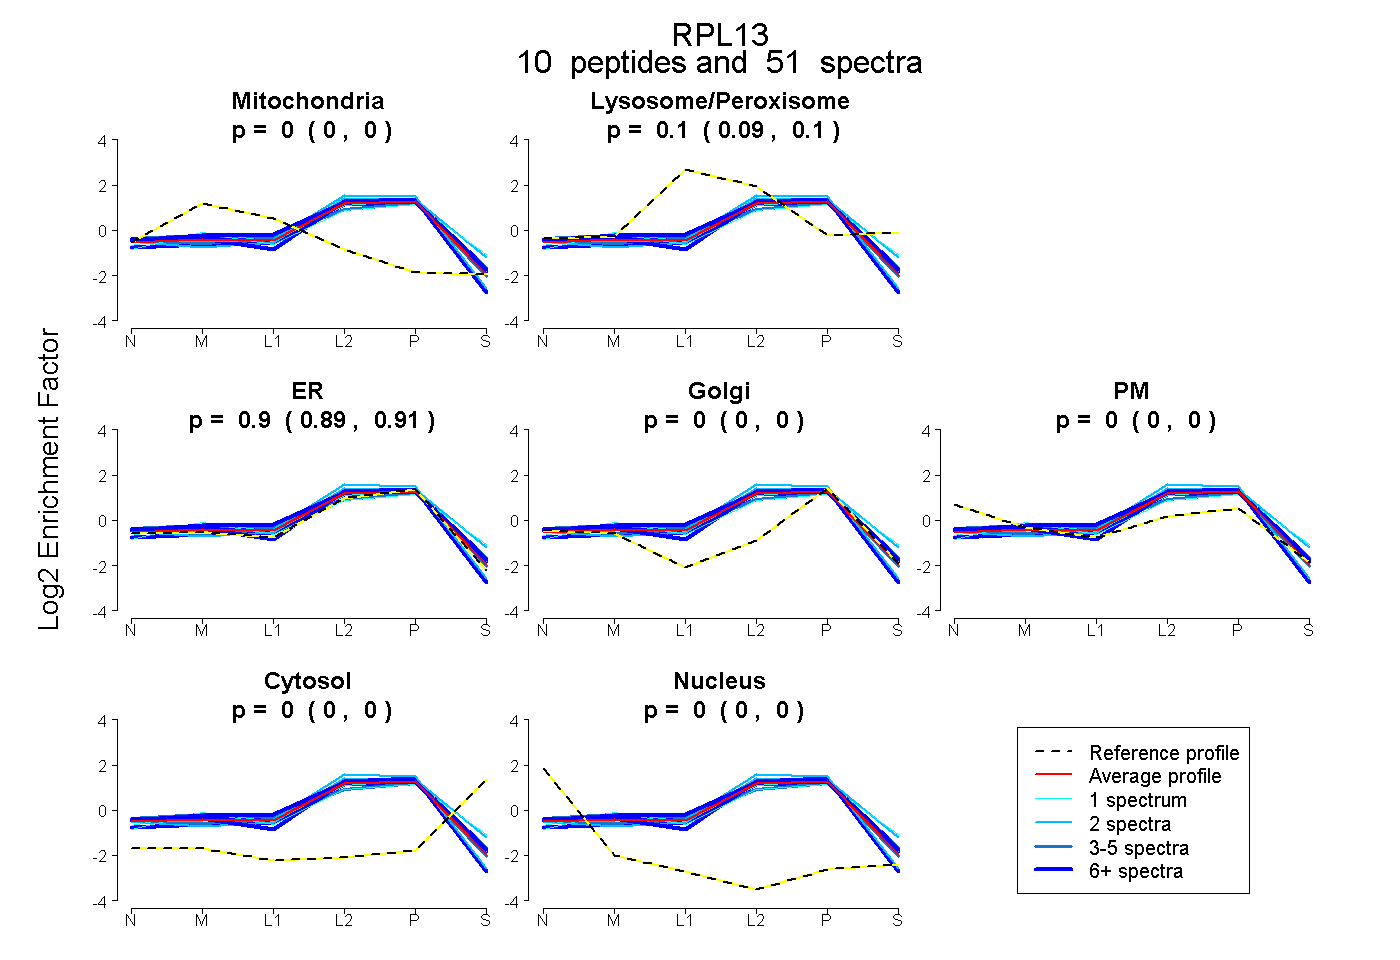 |
0.000 0.000 | 0.000 |
0.098 0.092 | 0.104 |
0.902 0.895 | 0.907 |
0.000 0.000 | 0.000 |
0.000 0.000 | 0.000 |
0.000 0.000 | 0.000 |
0.000 0.000 | 0.000 |
|||
| Plot | Lyso | Other | |||||||||||
| Expt C |
1 peptide |
4 spectra |
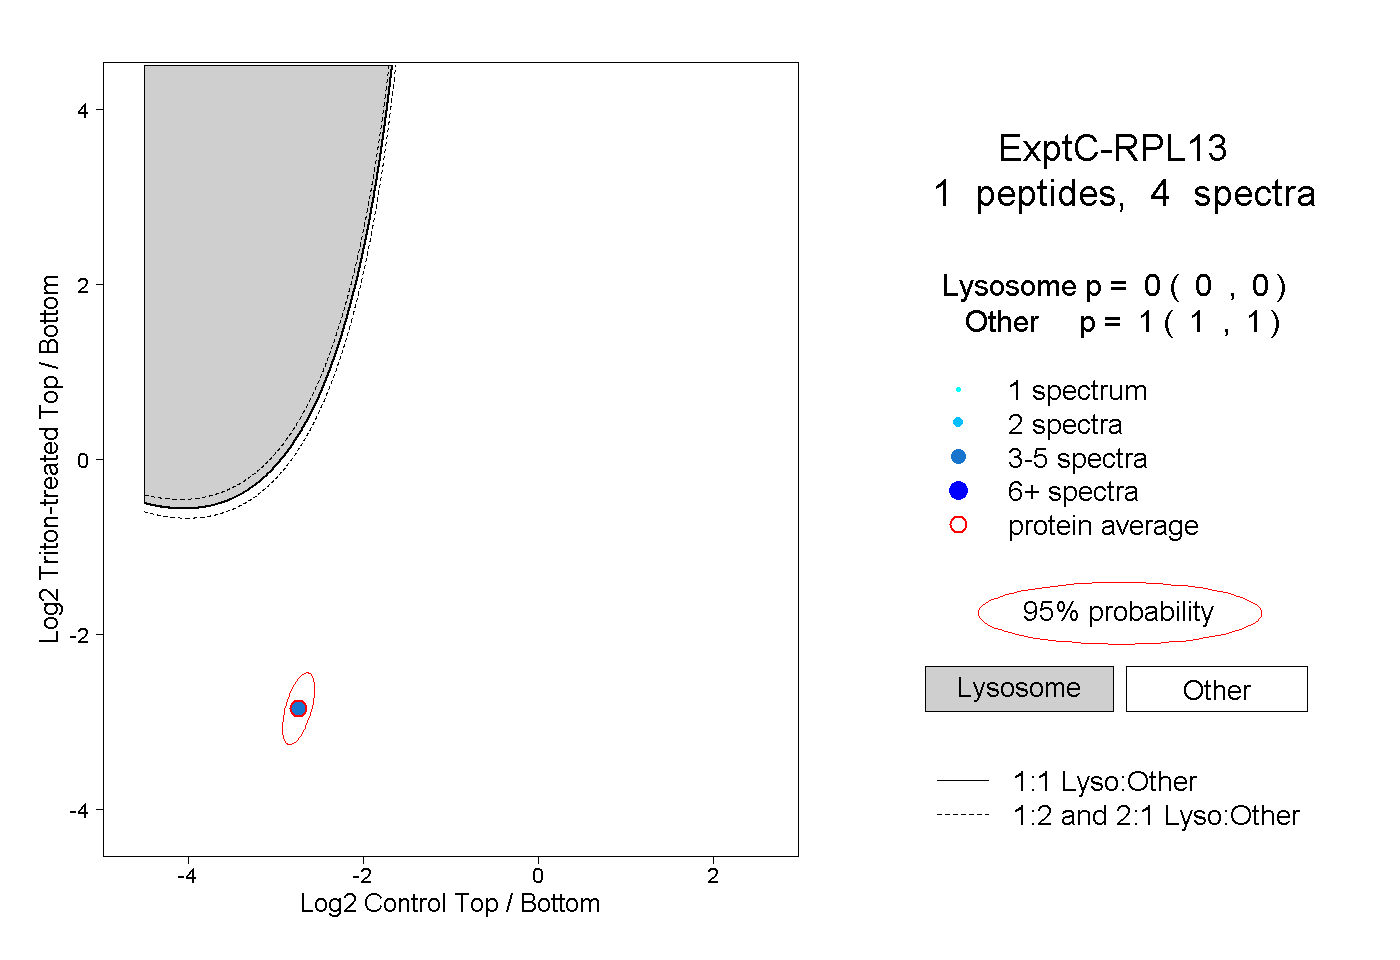 |
0.000 0.000 | 0.000 |
1.000 1.000 | 1.000 |
||||||||
| Plot | Lyso | Other | |||||||||||
| Expt D |
8 peptides |
24 spectra |
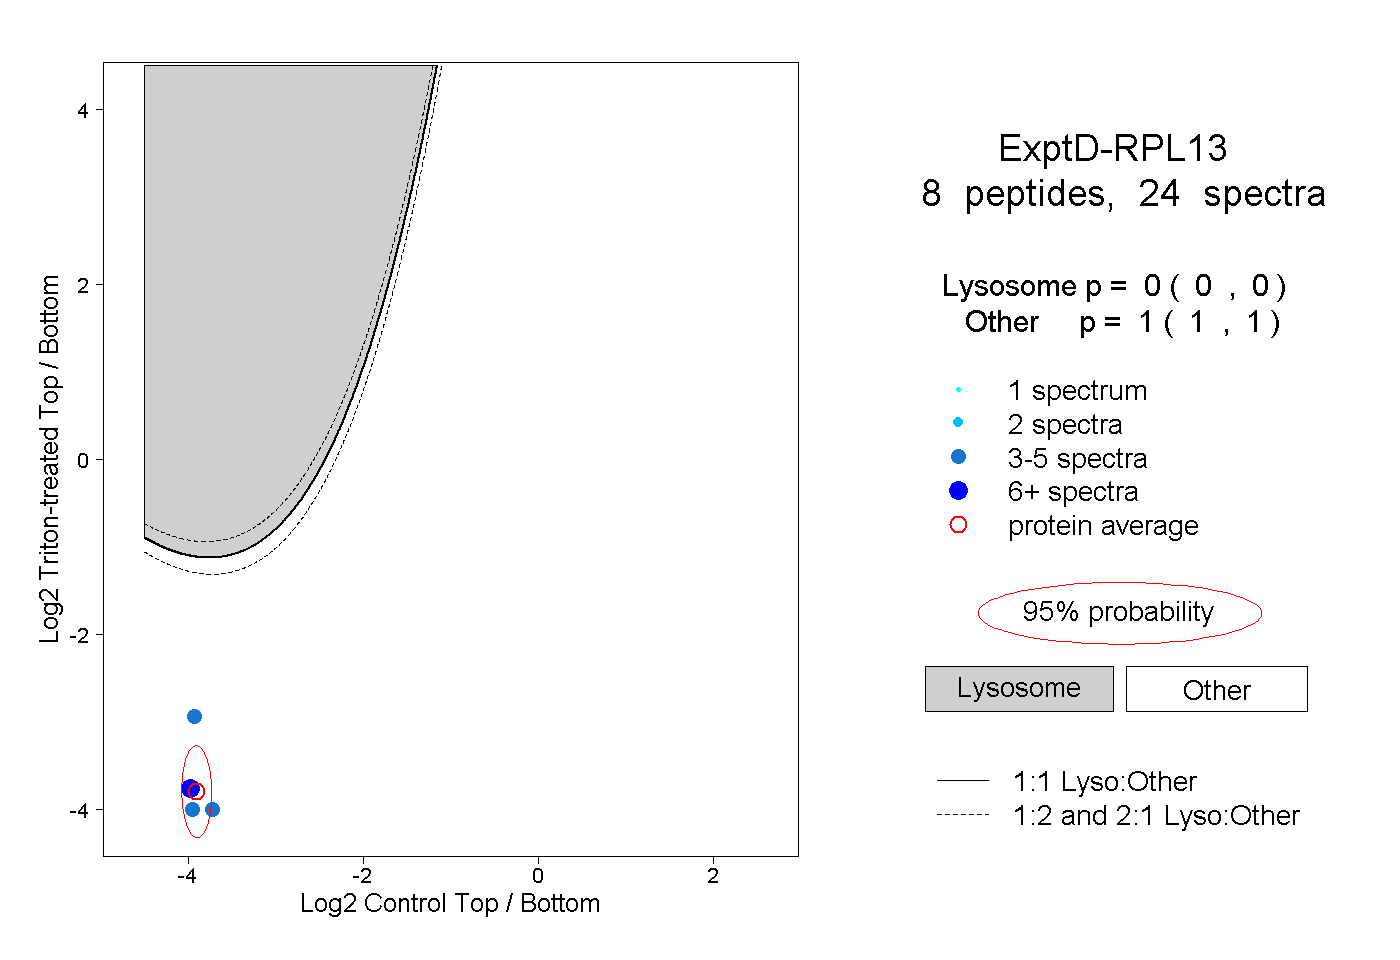 |
0.000 0.000 | 0.000 |
1.000 1.000 | 1.000 |